EN
EN

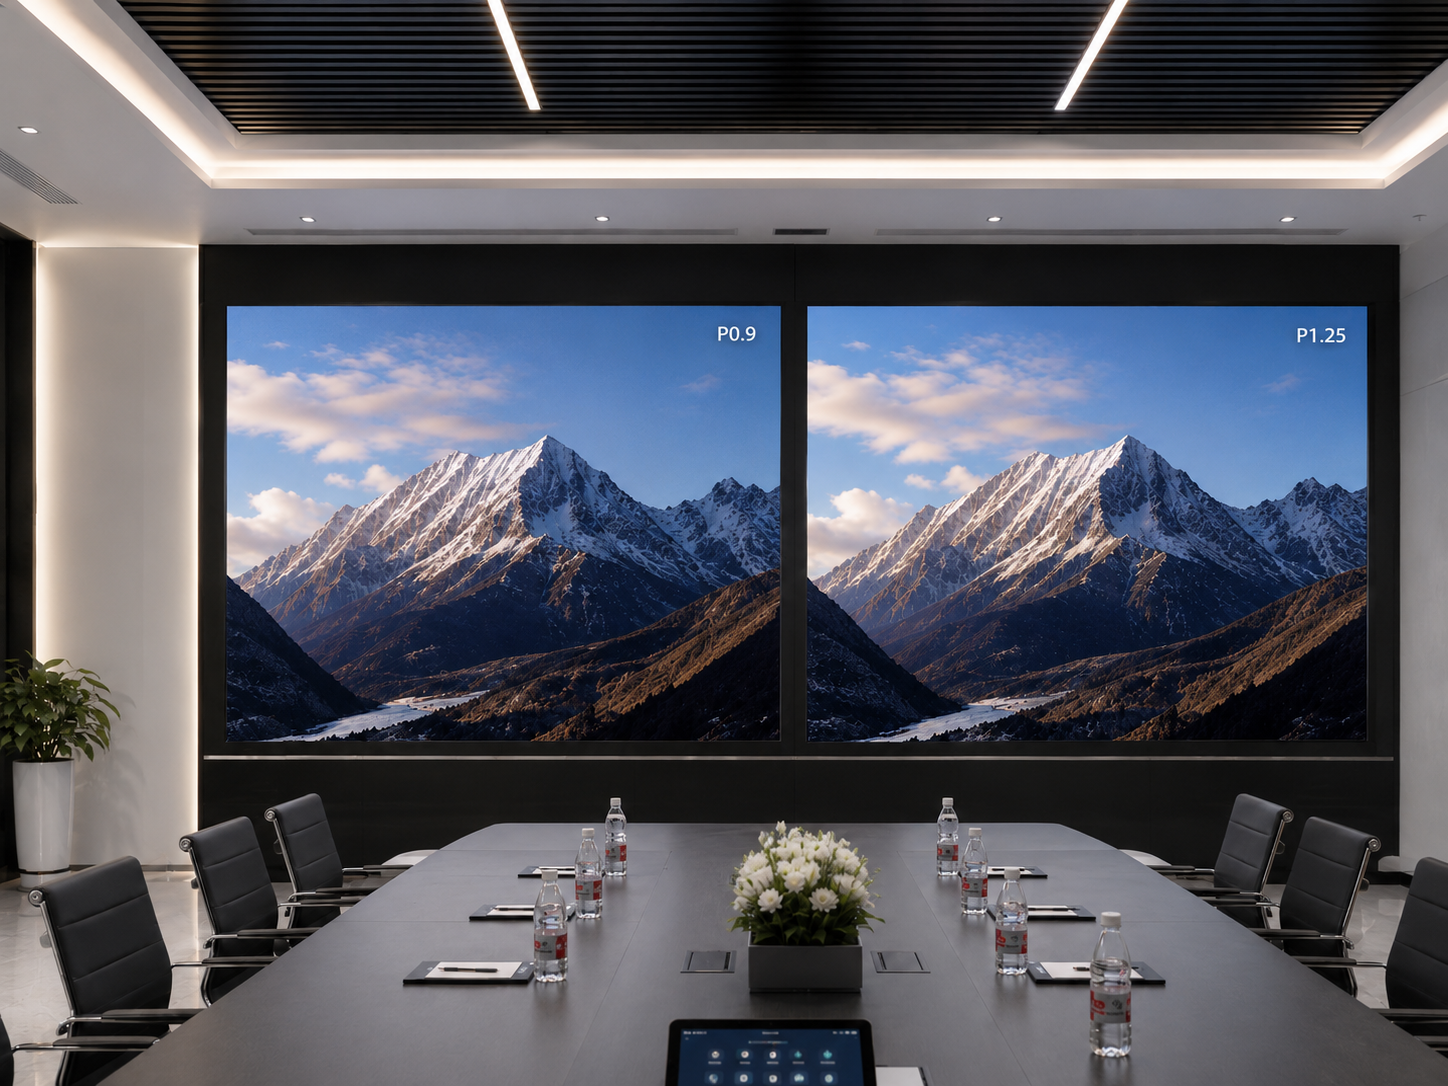
The P0.9 vs P1.25 fine pitch LED display decision should begin with wall dimensions, source layout, and the closest working position. A smaller pitch places more pixels inside the same area. However, the additional density only creates value when it solves a visible project problem. Compact control rooms may need native 4K inside a restricted opening. Meanwhile, a larger meeting room may achieve clear text, easier servicing, and a lower total system cost with P1.25.
This comparison uses P0.9375 as the actual reference for the P0.9 product class. That distinction changes the pixel-density calculation and the physical size of a Full HD or 4K wall. It also allows the comparison to use a real 600 × 337.5 mm cabinet instead of a theoretical screen with dimensions that cannot be assembled from the proposed hardware.
The practical answer
P0.9375 is more likely to justify its added cost when native resolution must fit inside limited width or height, small operational text cannot be enlarged, and the nearest viewing position is short. P1.25 usually provides the stronger balance when the room allows a larger wall and the real content remains readable during a controlled sample test.
 Review P0.9375 and P1.25 Product Options
 The same cabinet platform can support different pixel matrices, so the correct comparison must include physical size, source resolution, maintenance, and room use.
1. How Much Pixel Density Does P0.9375 Add?
Pixel pitch measures the center-to-center distance between neighboring LED pixels. A shorter distance places more pixels inside the same square meter. Even so, the commercial name P0.9 does not always mean an exact 0.9000 mm grid. In this product family, the actual comparison is 0.9375 mm against 1.25 mm.
That difference matters because theoretical 0.9 mm calculations would overstate the density of the proposed P0.9375 cabinet. Accurate architectural drawings, processor loading, cabinet quantities, and quotation comparisons should use the exact pitch. Rounded product names are useful during early research, but they should not control final engineering.
Pixel-density formula
Pixels per square meter = (1,000 ÷ exact pitch in millimeters)²
P0.9375: (1,000 ÷ 0.9375)² ≈ 1,137,778 pixels/m²
P1.25: (1,000 ÷ 1.25)² = 640,000 pixels/m²
Density increase: 1,137,778 ÷ 640,000 ≈ 1.778, so P0.9375 provides about 77.8% more pixels per square meter.
The 77.8% increase describes addressable pixels, not a guaranteed improvement in perceived quality. A bright demonstration video may look similar on both pitches from a normal room distance. By contrast, a dense alarm table, engineering drawing, or multiview control layout can expose the extra pixel rows much more clearly.
Cabinet resolution shows the same difference in a form that is easier to use during planning. A 600 × 337.5 mm P0.9375 cabinet provides 640 × 360 pixels. The same physical P1.25 cabinet provides 480 × 270 pixels. Therefore, P0.9375 places one-third more pixels across the width and one-third more pixels across the height.
| Decision Factor | P0.9375 | P1.25 | Project Meaning |
|---|---|---|---|
| Exact pixel pitch | 0.9375 mm | 1.25 mm | Use exact values in calculations and drawings. |
| Pixel density | About 1.138 million pixels/m² | 640,000 pixels/m² | P0.9375 provides about 77.8% more pixels. |
| Cabinet dimensions | 600 × 337.5 mm | 600 × 337.5 mm | The wall can use the same physical cabinet format. |
| Cabinet resolution | 640 × 360 pixels | 480 × 270 pixels | P0.9375 reaches a target canvas with fewer cabinets. |
| Referenced package | COB | SMD1010 | Pitch and packaging must be compared separately. |
| Common selection direction | Restricted wall area, short viewing, dense content | Larger wall area, practical text, lifecycle balance | The content test should confirm the pitch. |
Compare Equal Wall Size and Equal Resolution
An equal-size comparison keeps the physical wall dimensions unchanged. Under that method, P0.9375 delivers a larger pixel canvas. This comparison answers whether additional detail improves the planned dashboard, map, spreadsheet, camera mosaic, or presentation layout.
An equal-resolution comparison keeps the pixel matrix unchanged. Under that method, P0.9375 needs less physical wall area. This comparison answers whether the finer pitch solves a fixed architectural opening or only produces a smaller image than the room needs.
Both methods belong in the quotation. Otherwise, a lower price may simply represent a smaller resolution or a different wall size. The technical and commercial teams should compare active dimensions, cabinet count, total pixels, processor scope, support structure, power distribution, spares, and commissioning under the same assumptions.
Where This Product Family Fits
2. Full HD and 4K Wall Size Calculations
Resolution planning becomes more useful when the pixel matrix is converted into physical width and height. Full HD contains 1,920 × 1,080 pixels. In this article, 4K UHD refers to a 3,840 × 2,160 pixel canvas, which is also the standard UHD format described in technical references from the International Telecommunication Union.
The theoretical calculation uses pixel count multiplied by exact pitch. The construction calculation then checks whether the result aligns with complete modules and cabinets. In this case, both target resolutions align cleanly with the referenced 600 × 337.5 mm cabinet.
Dimension formulas
Width in meters = horizontal pixels × pitch in millimeters ÷ 1,000
Height in meters = vertical pixels × pitch in millimeters ÷ 1,000
Active area = width × height
Full HD at P0.9375
The active width equals 1,920 × 0.9375 ÷ 1,000, which produces 1.8 meters. The active height equals 1,080 × 0.9375 ÷ 1,000, which produces 1.0125 meters. Therefore, the theoretical active area is about 1.8225 square meters.
The result matches a complete cabinet grid. Three 640 × 360 cabinets across provide 1,920 horizontal pixels. Three cabinets high provide 1,080 vertical pixels. As a result, a 3 × 3 P0.9375 wall produces native Full HD at 1.8 × 1.0125 meters.
Full HD at P1.25
The active width equals 1,920 × 1.25 ÷ 1,000, which produces 2.4 meters. The active height equals 1,080 × 1.25 ÷ 1,000, which produces 1.35 meters. Accordingly, the active area becomes 3.24 square meters.
Four 480 × 270 cabinets across provide 1,920 horizontal pixels. Four cabinets high provide 1,080 vertical pixels. Therefore, a 4 × 4 cabinet grid reaches native Full HD without source cropping or fractional cabinets.
Native 4K at P0.9375
The active width equals 3,840 × 0.9375 ÷ 1,000, which produces 3.6 meters. The active height equals 2,160 × 0.9375 ÷ 1,000, which produces 2.025 meters. The complete active area is 7.29 square meters.
Six P0.9375 cabinets across supply the required 3,840 pixels. Six cabinets high supply 2,160 pixels. Consequently, a compact 6 × 6 cabinet wall creates a native 4K canvas inside an opening slightly wider than 3.6 meters after trim and installation clearance are added.
Native 4K at P1.25
The active width equals 3,840 × 1.25 ÷ 1,000, which produces 4.8 meters. The active height equals 2,160 × 1.25 ÷ 1,000, which produces 2.7 meters. As a result, the active area becomes 12.96 square meters.
Eight cabinets across and eight high create the required 3,840 × 2,160 matrix. Compared with P0.9375, P1.25 needs 1.2 meters more active width and 0.675 meters more active height for native 4K. The difference can determine whether the screen fits below a ceiling feature or between fixed columns.
| Target Canvas | P0.9375 Cabinet Grid | P0.9375 Active Size | P1.25 Cabinet Grid | P1.25 Active Size |
|---|---|---|---|---|
| 1920 × 1080 | 3 × 3 cabinets | 1.8 × 1.0125 m | 4 × 4 cabinets | 2.4 × 1.35 m |
| 3840 × 2160 | 6 × 6 cabinets | 3.6 × 2.025 m | 8 × 8 cabinets | 4.8 × 2.7 m |
| Full HD active area | About 1.8225 m² | 3.24 m² | ||
| 4K active area | 7.29 m² | 12.96 m² | ||
A 4K Source Does Not Always Require a Native 4K Wall
A laptop output label does not define the required LED canvas. Presentation slides, videoconference participants, maps, surveillance feeds, dashboards, and browser windows use resolution differently. The operating layout should therefore control the wall matrix.
For example, four Full HD sources can occupy a native 4K canvas without scaling. A control room showing one main map, six camera feeds, and several alarm lists may need a different arrangement. The smallest critical label and the size of each source window can matter more than the nominal resolution of the input cable.
Meeting rooms often receive 4K computer signals but display large text and full-screen participants. In that case, P1.25 may provide enough native detail when the screen is large and the first row is not extremely close. Meanwhile, a compact briefing room may need P0.9375 because the architectural opening cannot hold a 4.8-meter-wide wall.
Round the Calculation to Real Hardware
Some LED walls do not align as cleanly as the examples above. A proposed cabinet may produce a nearby resolution rather than an exact 16:9 canvas. In that situation, the processor must scale, crop, or letterbox the source.
The final project record should list cabinet quantity across and high, active resolution, physical dimensions, processor output loading, source-mapping method, and final content template. It should also distinguish active image size from the complete installed envelope.
- Record the exact module and cabinet pitch.
- State the cabinet pixel matrix and physical dimensions.
- Confirm the number of cabinets across and high.
- State the final active width, height, and total resolution.
- Add the structure, trim, cable, and maintenance clearance.
- Confirm processor ports, output loading, and backup requirements.
- Prepare a content template using the final pixel canvas.
This step prevents architectural drawings from using a theoretical dimension that cannot be built. It also prevents the content team from preparing a 16:9 layout for a screen with a different final aspect ratio.
3. Closest Viewing Distance and Text Readability
Viewing distance is often reduced to a simple pitch rule. That rule can support early screening, but it cannot approve a close-view wall. Video, large presentation text, spreadsheets, maps, alarm lists, engineering lines, and camera timestamps place different demands on the pixel grid.
AVIXA also notes that pixel pitch affects both acceptable viewing distance and cost, while the final acceptable distance depends on the intended viewing experience. The AVIXA pixel-pitch reference is useful for early planning. Even so, actual operating content should make the final decision.
Small Text Is More Demanding Than Video
Motion, texture, and natural image detail can hide individual pixels. Small text behaves differently because it depends on sharp corners, thin strokes, repeated lines, and stable contrast. As a result, alarm lists and map labels often expose pitch and scaling limits before video does.
Font choice also changes the result. Medium-weight sans-serif text usually remains more stable than a thin decorative font. Likewise, a dashboard with clear hierarchy can reduce the need for the finest available pitch.
A smaller pitch cannot rescue text that is physically too small for the working distance. Enlarging the text, reducing the number of windows, or moving secondary data to operator monitors may improve usability more than increasing wall density.
Test the Real Content, Not a Showreel
A product demonstration should include the most difficult operating page. Bright landscapes and promotional footage may look attractive, but they do not reveal whether fine gray grid lines, small labels, and dark user interfaces remain readable.
Recommended content test package
- Small white text on dark gray
- Dark text on a light interface
- Red, amber, green, and blue alarm labels
- Fine map boundaries and location names
- Engineering lines and CAD annotations
- Spreadsheet grids at the normal zoom level
- Surveillance timestamps and camera names
- Videoconference participant labels
- One-pixel and two-pixel line patterns
- Dark gradients and low-gray patches
- Actual presentation slides and operating dashboards
Measure Three Viewing Positions
The closest position reveals pixel structure, text edges, low-gray noise, surface reflections, and module seams. The typical position shows whether daily work remains comfortable. The farthest position confirms whether critical labels and status indicators remain large enough for group viewing.
Measurements should begin at the LED surface rather than the mounting wall. Desk depth, seated eye position, standing areas, circulation paths, and side angles should also appear on the drawing. A nominal room depth does not describe the actual working distance.
Brightness must remain realistic during this test. A sample running at maximum output can appear sharper and more vivid, yet it may be uncomfortable during a long control-room shift. Both pitches should use the same source, processor, scaling method, and operating brightness.
Practical Sample-Test Procedure
- Prepare the final dashboard, map, presentation, or camera layout.
- Use the proposed processor and source-scaling method.
- Set both samples to the intended room brightness.
- View the screen from the closest planned position.
- Read the smallest operational text without moving closer.
- Inspect thin lines, alarm colors, gradients, and dark interfaces.
- Move to the normal working position and repeat the test.
- Record both samples with the planned room camera when relevant.
- Document only differences that affect a real task.
- Attach the result to the pitch-selection record.
When P0.9375 Creates a Visible Advantage
P0.9375 becomes more defensible when native 4K must fit inside an active width of 3.6 meters. It also gains value when operators sit close to the wall and critical text cannot be enlarged without removing required information.
Dense map layers, compact multiview layouts, engineering detail, and premium close-range presentations can create a similar need. In each case, the finer pitch should solve an observed problem during the sample test.
When P1.25 Is the Better-Balanced Choice
P1.25 becomes attractive when the room can hold a 2.4-meter-wide Full HD wall or a 4.8-meter-wide native 4K wall. It also works well when presentation fonts, dashboard labels, and camera windows remain clear from the nearest position.
Under those conditions, P1.25 can provide a larger physical image and a more practical balance among initial cost, spare inventory, repair handling, and long-term support. The result should still pass the same content, brightness, and camera tests.
4. COB, SMD, and Micro LED Terms in This Comparison
Pixel pitch, emitter size, packaging, surface treatment, and display architecture describe different parts of a product. Mixing those terms can create an inaccurate comparison. A P0.9 micro LED display search, for example, may combine a pitch class with a broader technology label.
The referenced product configuration lists P0.9375 with COB and P1.25 with SMD1010. That specification is useful for this product comparison, but it should not become a universal rule. Other P1.25 products may use different packaging, while other P0.9-class products may use different chip and surface structures.
What SMD Changes
SMD means surface-mounted device. Packaged LED components mount onto the printed circuit board. The final service method depends on component size, soldering, coating, module construction, repair tools, and technician capability.
Suitable SMD modules may support component-level repair in a controlled workshop. However, exposed fine-pitch components require careful transport, handling, and cleaning. Edge protection and approved maintenance tools should therefore form part of the proposal.
What COB Changes
COB means chip on board. LED chips attach directly to the board before encapsulation or surface treatment. This approach can create a flatter and more protected module surface, although the exact result depends on the complete production process.
A protected COB surface may reduce handling risk during normal operation. Meanwhile, field repair may shift from replacing individual emitters toward replacing complete modules. Spare matching, depot repair, and calibration recovery can therefore carry greater importance.
Pitch Does Not Define the LED Chip Size
A 0.9375 mm pitch describes the distance between neighboring pixels. It does not state the physical size of each emitting chip. Likewise, Micro LED may describe emitter dimensions, a self-emitting architecture, or a commercial product category.
The useful project questions concern exact pitch, package type, surface protection, reflection, black level, heat path, module replacement, calibration, and spare compatibility. The Mini LED and Micro LED terminology guide covers the broader technology definitions without repeating them here.
Questions that turn packaging labels into service information
- What is the exact pixel pitch?
- Which emitter and package structure does the module use?
- Does the surface use coating or full encapsulation?
- How does the surface respond to room reflections?
- Which parts can be replaced from the front?
- Can individual components be repaired locally?
- Which removal and repair tools are required?
- How are replacement modules recalibrated?
- How are spare modules matched to the original batch?
- Which cleaning method is approved?
- Where does component-level repair take place?
5. Brightness, Contrast, Low Gray, Color, and Camera Performance
Fine-pitch indoor walls usually operate below maximum brightness. A control room may run for long periods, while a meeting wall may sit close to the first row. Excessive output can increase fatigue, strengthen reflections, and make dark interfaces uncomfortable.
Maximum brightness should therefore not lead the comparison. The more useful test is whether both options maintain stable grayscale, color balance, uniformity, and camera behavior at the intended operating level.
Test Several Real Operating Levels
A practical evaluation should include a normal daytime level, a lower dark-room level, and a temporary brighter presentation mode. At each setting, the screen should display gradients, skin tones, solid colors, text, and near-black content.
Low brightness can reveal color tint, grayscale jumps, banding, and noisy dark areas. Those issues may remain hidden during a bright demonstration. Consequently, the sample test should reproduce the expected room light and processor configuration.
Contrast Is a Room-Level Result
Published contrast ratios may use different measurement methods. Practical contrast also depends on the module surface, ambient light, screen reflections, cabinet alignment, calibration, viewing angle, and surrounding finishes.
A glossy surface may appear deep black in a dark demonstration area but reflect ceiling lights in a meeting room. A matte surface may control those reflections, although it can change perceived sharpness. A black-screen test under final room lighting is therefore more valuable than one isolated ratio.
Low-Gray Performance Affects Real Content
Surveillance feeds, shaded maps, dark presentation themes, product films, and videoconference scenes contain many near-black tones. Weak low-gray behavior can produce banding, blocked shadows, color shifts, or sudden changes between dark levels.
Useful test files include one-percent to ten-percent gray patches, black-to-gray ramps, dark red and blue gradients, shadow detail, fine gray grids, and low-saturation skin tones. Both pitches should receive the same source signal and processor settings.
Uniformity Must Include Future Replacement Modules
A large wall combines many modules and cabinets. Small differences can create visible blocks, lines, or color patches. Initial calibration can improve consistency, but replacement planning determines how well the wall returns to a uniform state after maintenance.
The handover package should include calibration files, controller backups, spare-module identifiers, and a replacement correction method. Each changed module should also be recorded by date and wall position.
- Confirm module-level and whole-wall calibration.
- Back up receiving-card and processor configurations.
- Match spare modules to the original production batch.
- Define replacement-module correction steps.
- Record every repaired or replaced position.
- Confirm access for later camera-based recalibration.
Camera Performance Needs Its Own Acceptance Test
A wall may appear stable to the eye but show bands, flicker, or moiré on camera. Meeting rooms, briefing spaces, studios, and showrooms may use videoconference cameras, broadcast cameras, mobile phones, or documentation photography.
Refresh rate alone does not define the recorded result. Scan behavior, grayscale control, processor timing, screen brightness, frame rate, shutter settings, camera distance, and lens choice also contribute. Both pitches should be recorded with the planned camera before approval.
Compare Total Power at the Proposed Wall Size
The denser pitch does not automatically create the larger total electrical load. P0.9375 needs less wall area for the same native resolution, while P1.25 needs a larger canvas. Driver design, brightness, content, power-supply loading, and redundancy also affect consumption.
Each quotation should state maximum power per square meter, expected operating power per square meter, and the assumptions behind the average figure. The comparison should then multiply those values by the actual proposed screen area.
Electrical information required in the proposal
- Maximum connected load
- Expected operating load
- Brightness and content assumptions
- Circuit and distribution plan
- Power redundancy method
- Estimated heat output
- Ventilation or room-cooling requirement
6. Cost, Spares, Front Service, and Lifecycle Planning
The finer pitch normally carries a higher panel cost under comparable product conditions. However, P0.9375 also needs fewer cabinets for the same native resolution. A reliable comparison should therefore cover the complete installed system rather than price per square meter alone.
P0.9375 may reduce wall area, structure size, trim length, and occupied room space. Meanwhile, the denser modules, spare inventory, repair process, and calibration requirements may carry a higher value. P1.25 may require more area, yet it can provide a more manageable lifecycle balance when the room has enough space.
Compare the Same Commercial Scope
One quotation may include LED cabinets only. Another may include support structure, processor, switching, power distribution, calibration, commissioning, training, spares, and documentation. The totals cannot be compared until the scope is normalized.
Display hardware
Modules, cabinets, receiving hardware, power supplies, cables, and required redundancy.
Installation scope
Structure, trim, lifting, access equipment, labor, and protection of the finished room.
Signal and control
Processor, switching, source interfaces, extension, control computer, and backup paths.
Handover and service
Calibration, commissioning, training, files, spares, tools, and future service support.
Use Three Cost Comparison Models
The equal-size model compares both pitches inside the same physical wall. It shows the added cost of more density and whether that density improves the intended content.
The equal-resolution model compares the dimensions needed for Full HD or 4K. It shows whether the larger P1.25 wall changes structure, room layout, installation, power, cooling, or viewing experience.
The minimum-acceptable-result model configures both pitches to pass the same text, source-layout, service, and camera requirements. This approach can identify the lowest complete project cost without sacrificing an operating requirement.
Spare Quantity Should Follow the Operating Risk
A fixed spare percentage does not suit every installation. Module quantity, operating hours, transport time, batch matching, local repair capability, storage conditions, and acceptable downtime all influence the required inventory.
A small wall may need a higher percentage because one module represents a larger part of the total installation. A larger wall may use a lower percentage but still hold more physical spare units. The proposal should therefore state quantities and part types rather than only one percentage.
- Spare LED modules by quantity and production batch
- Spare cabinets when the operating model requires them
- Spare receiving cards and hub boards
- Spare power supplies and power accessories
- Approved module-removal and repair tools
- Storage temperature and protective packaging
- Inventory labels and wall-position records
- Recalibration steps after replacement
- Restocking process after a spare enters service
Front Service Must Cover the Complete Cabinet
The referenced P0.9375 and P1.25 options use front maintenance. Even so, the phrase can describe different access levels. One design may allow front module removal while still requiring rear access for power supplies or receiving cards.
The service demonstration should identify every replaceable component and its removal path. Edge and corner positions deserve special attention because walls, columns, trim, and ceiling details may restrict tool movement.
Module removal force also matters. A suction or magnetic tool should remove the module without damaging nearby surfaces. Cable slack, connector position, cabinet alignment, and recalibration should then be checked during reinstallation.
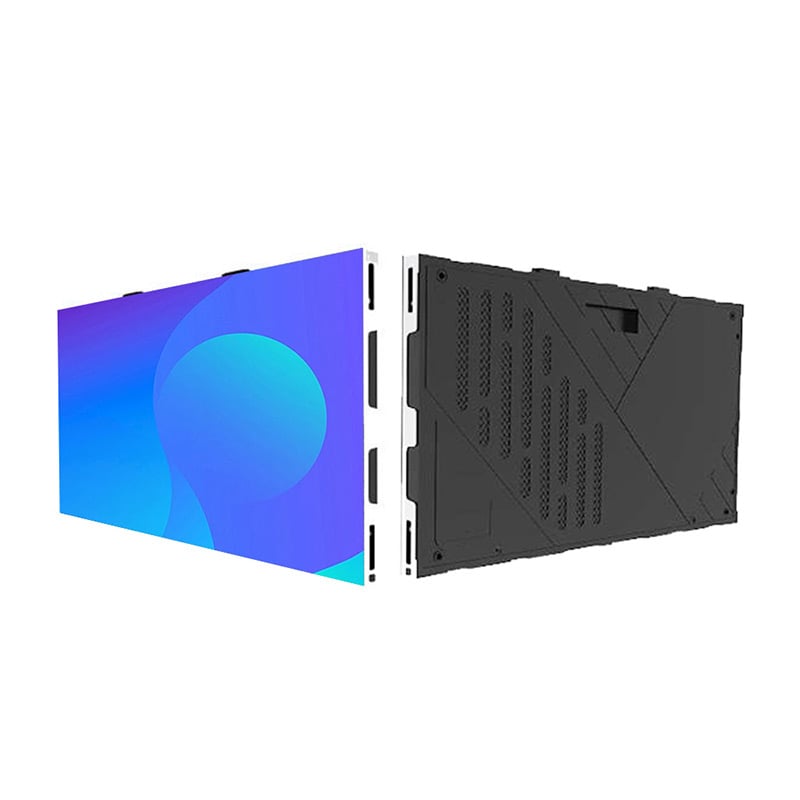
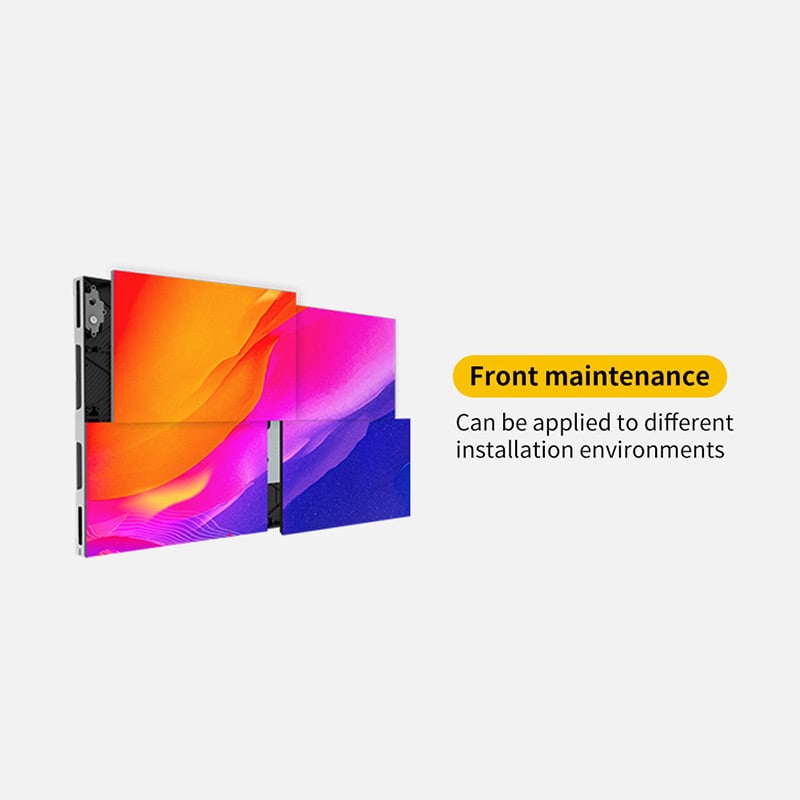
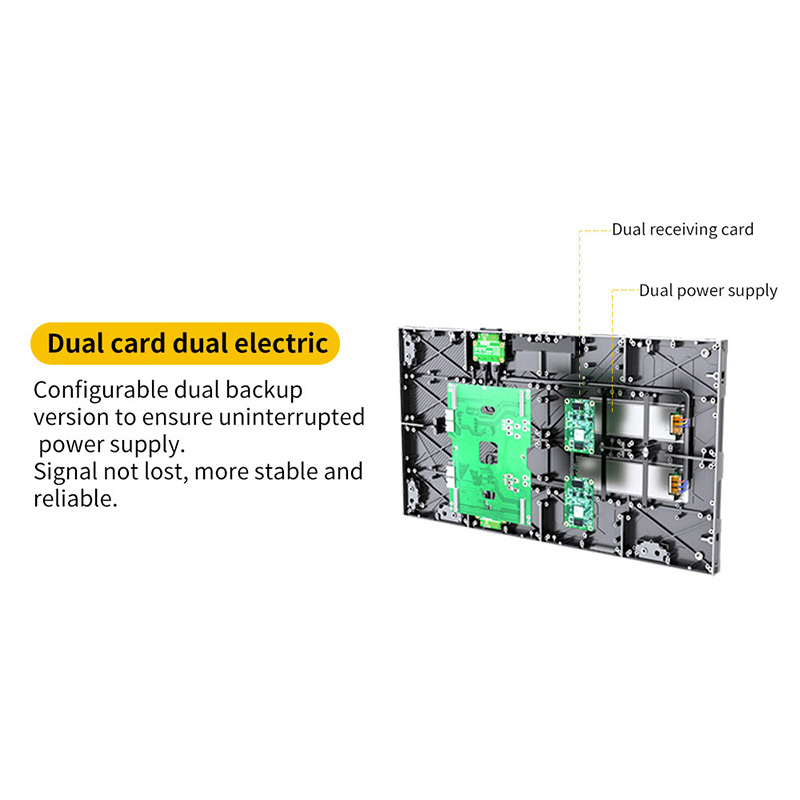
The physical service route, spare strategy, receiving-card layout, and power architecture should be reviewed together with pixel pitch.
Decide Where Repairs Will Occur
SMD and COB modules may follow different repair routes. Some SMD modules support controlled component repair in a suitable workshop. Protected COB structures may favor complete module replacement followed by depot repair.
The commercial agreement should state whether repair occurs on the wall, in a local workshop, at a regional service center, or at the production facility. Transport packaging, temporary replacement, calibration files, expected turnaround, and cost responsibility should also be defined.
Plan for the Full Operating Life
Operating schedule can shift the selection. A short daily presentation wall has different service priorities from a control room that runs continuously. Static content, frequent source changes, camera use, and strict uptime also change the support requirement.
- How many hours will the wall operate each day?
- Does the room require continuous operation?
- How often will source layouts change?
- Will brightness change according to room schedules?
- Will cameras regularly record the wall?
- How quickly must a failed module be replaced?
- Where will spares and tools be stored?
- Which technical resources are available on site?
- How will calibration and configuration files be backed up?
- What happens when the original module batch is unavailable?
- Is signal redundancy required?
- Is power redundancy required?
- What downtime remains acceptable?
Write the Acceptance Plan Before Ordering
Acceptance language should describe clear tests rather than broad claims such as seamless, high contrast, or excellent color. The plan should identify the source files, room conditions, brightness, camera settings, and viewing positions used for approval.
| Acceptance Area | Required Check | Evidence to Retain |
|---|---|---|
| Physical build | Active dimensions, alignment, seams, trim, and service clearance | Measured drawings and installation photographs |
| Pixel canvas | Final matrix, aspect ratio, source mapping, and window layout | Processor configuration and canvas screenshot |
| Image quality | Text, low gray, gradients, color fields, and black-screen appearance | Approved test files and signed results |
| Camera use | Flicker, bands, moiré, and color at planned camera settings | Recorded sample clips |
| Service | Module, receiving card, power supply, and cable access | Service demonstration record |
| Handover | Spares, tools, files, manuals, and training | Signed inventory and document register |
7. Selection Matrix for Control Rooms, Meeting Rooms, Visualization Centers, and Showrooms
Different spaces assign different value to density, physical image size, text clarity, camera performance, service speed, and cost. A pitch that works well in a meeting room may not support a compact operations wall with dense alarm data.
The matrix below provides an initial direction. It does not replace a content sample, cabinet drawing, processor design, or commercial comparison.
| Project Scenario | Conditions Favoring P0.9375 | Conditions Favoring P1.25 | Required Validation |
|---|---|---|---|
| Control room | Compact opening, short operator distance, dense alarms, maps, or native 4K below four meters wide | Larger opening, practical dashboard fonts, moderate distance, and stronger lifecycle-cost priority | Test the most demanding operating page at normal brightness |
| Conference room | Close front seats, compact executive room, detailed spreadsheets, or limited wall width | Larger wall, presentation text, videoconferencing, and moderate front-row distance | Test slides, spreadsheets, and the planned camera |
| Data visualization center | Fine maps, engineering labels, compact multiview layouts, and close analytical work | Several viewing rows, larger wall area, and group-comprehension priority | Test the final canvas and smallest critical labels |
| Premium showroom | Close interaction, compact architectural feature, and detailed product imagery | Larger video surface, moderate visitor distance, and practical service planning | Test reflections, dark footage, texture, and brand colors |
| Broadcast-style briefing room | Compact high-resolution background inside a fixed camera frame | Camera distance and framing allow a larger wall | Record both options with the planned lens and shutter |
Control Rooms
P0.9375 is more likely to earn its added cost in a compact control room with dense alarm lists, fine map labels, engineering lines, or several source windows. The 3.6-meter-wide native 4K option can preserve resolution inside a restricted opening.
P1.25 remains practical when the room can support a larger wall and dashboard text can be enlarged. A wider physical image may improve group visibility, while the service and spare strategy may be easier to manage.
Uptime should carry equal weight with image density. Front access, on-site spares, receiving-card backup, power design, processor redundancy, and calibration recovery should appear in the final comparison.
Conference Rooms
P1.25 is usually the more balanced option when a 2.4-meter-wide Full HD wall fits the room and presentation text remains clear from the first row. Large slides and videoconference windows rarely need the same density as a compact alarm dashboard.
P0.9375 becomes worthwhile when a native 4K canvas must fit inside a 3.6-meter active width. It also gains value when detailed spreadsheets, design files, or several application windows must remain readable from close seats.
Camera testing remains essential in both cases. Moiré, scan bands, brightness, color temperature, and screen reflections can affect recorded meetings even when the wall looks stable to the eye.
Data Visualization Centers
Visualization spaces may combine maps, simulations, CAD drawings, scientific images, network models, charts, and live operational sources. Close analytical work can justify the higher density of P0.9375.
Several viewing rows can change that conclusion. When the room allows a 4.8-meter-wide 4K wall, P1.25 can provide a larger shared canvas without reducing native resolution. Physical image size may support group comprehension better than a smaller, denser wall.
Processor design should be planned with the wall matrix. The number of sources, scaling method, movable windows, backup paths, and control software can affect daily usability more than one resolution label.
Premium Showrooms
Showrooms place value on close-range texture, black-screen appearance, surface consistency, architectural integration, and visual impact. P0.9375 can reduce visible pixel structure on a compact feature wall.
A P1.25 fine pitch LED display can remain effective when the screen covers a larger surface and most content consists of video, product imagery, or large graphic elements. In that case, practical servicing may provide more value than maximum density.
Dark products, glossy materials, fine textures, skin tones, and brand colors should form part of the test. The wall should also be inspected while displaying black, because reflections and module boundaries often become more visible in that state.
Information Required for a Comparable Quote
Both pitch options should receive the same project brief. Otherwise, one proposal may assume a different wall size, processor, service scope, spare quantity, redundancy level, or installation method.
Room and wall
- Available active width and height
- Maximum installed dimensions
- Wall and structural conditions
- Access route and lift limits
- Front and rear clearance
- Room lighting and daylight
- Temperature and ventilation
- Noise restrictions
Viewing positions
- Closest working position
- Typical seated position
- Farthest viewing position
- Number of viewing rows
- Side viewing angles
- Desk depth and movement paths
- Camera positions
Content and signals
- Target canvas and aspect ratio
- Source resolutions
- Number of simultaneous sources
- Smallest critical text
- Map, CAD, or data detail
- Videoconference use
- Camera-recording requirements
- Input and control interfaces
Operation and service
- Daily operating hours
- Continuous-operation requirement
- Normal operating brightness
- Uptime and redundancy target
- Maintenance access
- Local technical capability
- Spare storage location
- Expected repair route
Commercial scope
- Display and processor scope
- Structure and trim
- Installation and commissioning
- Calibration and training
- Spare quantities
- Repair tools
- Documentation package
- Optional redundancy and support
A Simple Final Decision Sequence
- Define the maximum active wall dimensions.
- Define the required source canvas and window layout.
- Calculate both pitches using exact cabinet matrices.
- Measure the closest, typical, and farthest positions.
- Identify the smallest critical text and line detail.
- Test real content on both options at normal brightness.
- Record both screens with the planned camera.
- Review front service, spares, repair, and calibration.
- Compare equal-size and equal-resolution quotations.
- Select the lowest-cost option that passes every operating requirement.
- Attach the acceptance method to the order documents.
Frequently Asked Questions
How much more pixel density does P0.9 provide than P1.25?
The current P0.9-class reference uses an exact 0.9375 mm pitch. It provides about 1,137,778 pixels per square meter, while P1.25 provides 640,000. Therefore, P0.9375 offers about 77.8% more density. A theoretical exact 0.9000 mm calculation would produce a different number and should not replace the proposed module specification.
What screen size is needed for 4K at P0.9375 or P1.25?
A P0.9375 native 4K wall measures 3.6 × 2.025 meters and uses a 6 × 6 grid of 600 × 337.5 mm cabinets. A P1.25 native 4K wall measures 4.8 × 2.7 meters and uses an 8 × 8 cabinet grid. The complete installed size must also include structure, trim, cables, and service clearance.
Is P0.9 necessary for a conference room?
Not in every meeting room. P1.25 can provide clear slides and videoconference layouts when the wall is large enough and the front row is not extremely close. P0.9375 becomes more relevant when native 4K must fit inside a 3.6-meter active width or detailed spreadsheets and design files must remain readable from close seats.
How do COB and SMD affect fine-pitch maintenance?
SMD may support controlled component-level repair, while protected COB structures may favor complete module replacement and depot repair. The exact service route depends on the proposed module. Front access, removal tools, spare matching, recalibration, cleaning, and repair location should all be confirmed before ordering.
Should power consumption decide between P0.9375 and P1.25?
Power should form part of the decision, but pitch alone cannot predict total load. P0.9375 needs less screen area for the same native resolution, while P1.25 needs a larger wall. Compare the maximum and expected total system power at the proposed dimensions, brightness, content mix, and redundancy level.
Three actions before pitch approval
- Calculate both options with the exact pitch and cabinet grid.
- Test critical text, dark content, and camera behavior from planned positions.
- Compare the same installation, processing, spare, and service scope.
Prepare a Project-Specific Comparison
The final P0.9 vs P1.25 fine pitch LED display choice should connect screen dimensions with real content, closest viewing distance, service access, and lifecycle requirements. Send screen size, target resolution and closest viewing distance for a P0.9/P1.25 comparison. Installation conditions, source layouts, camera use, signal interfaces, and control-system details will make the quotation more accurate.
Send Project Requirements