EN
EN

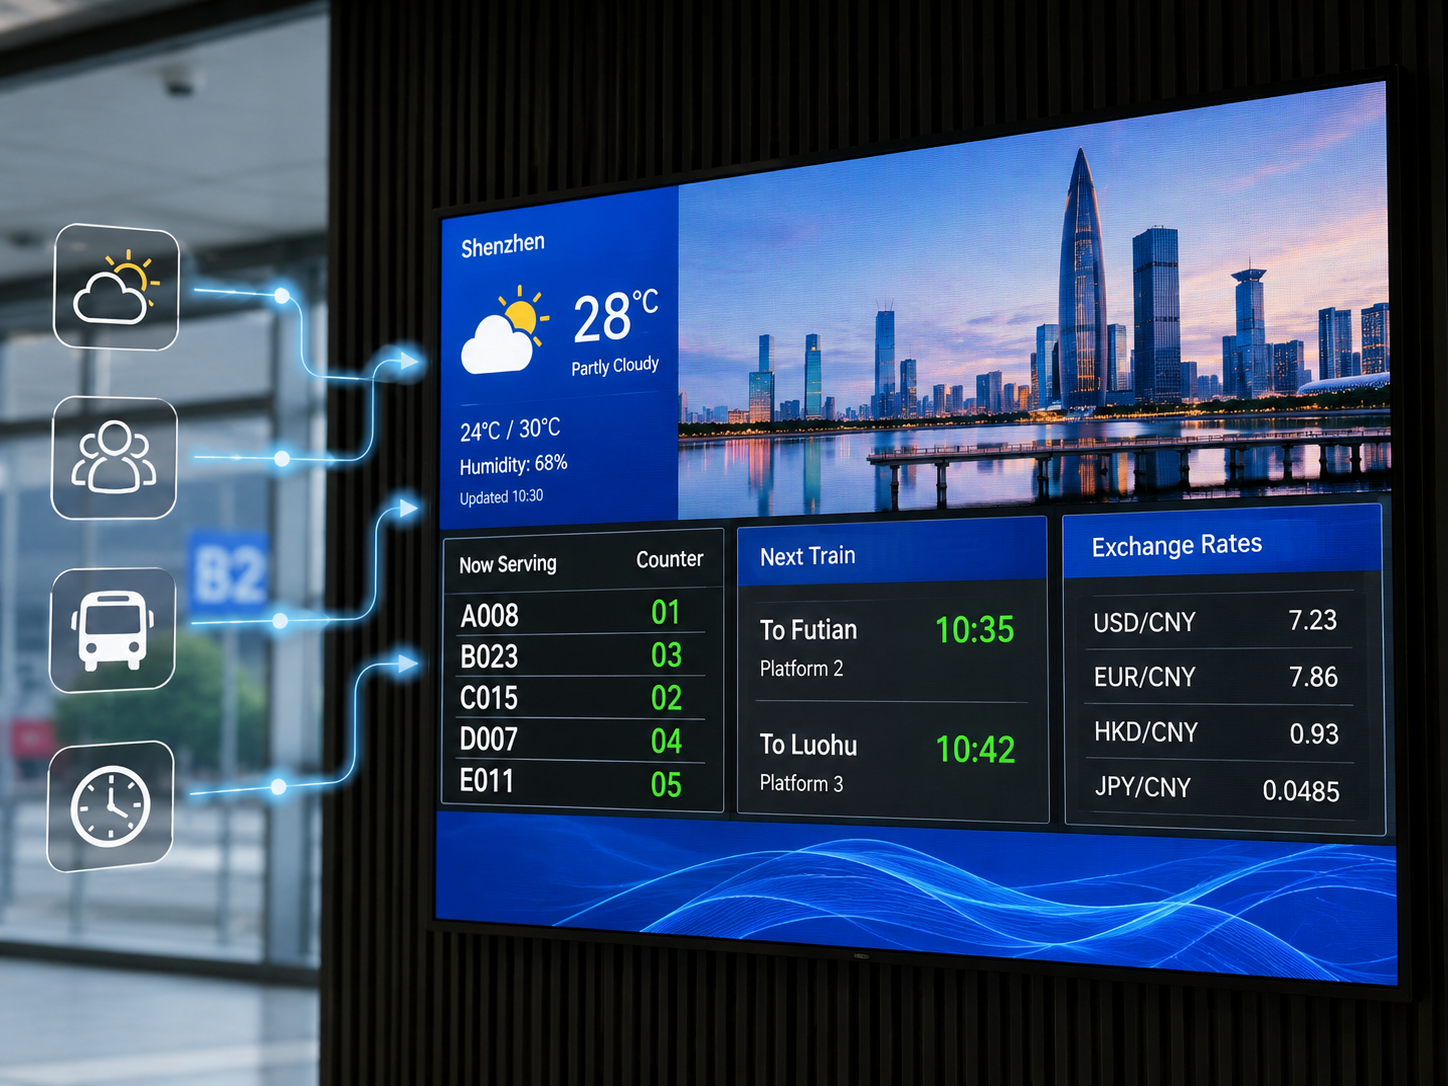
A custom led display board becomes a different kind of display once the information on screen comes from a changing business system. A weather temperature can expire. A queue number can move to another counter. A transport service can become delayed. A price can change while the background artwork stays exactly the same. In these projects, the screen is no longer only playing media. It is presenting the current state of another information system.
That changes the engineering question. The difficult part is rarely drawing a box for a number or connecting an API once. Instead, the important decisions are where each value comes from, which layer decides whether it is still trustworthy, how several live regions share one canvas, and what appears when the source stops updating. This guide stays on that boundary: external business data entering the content workflow, plus the fallback logic that keeps the screen meaningful when live data is unavailable.
The Same LED Screen Can Carry Three Very Different Types of Content
An LED Display Board can show a campaign image, follow a timed playlist, and present a live queue number on the same physical canvas. Visually, those elements may look equally simple. Operationally, however, they behave very differently.
A prepared image already exists before playback starts. A scheduled scene already knows when it should appear. Live information is different because the value may not exist until another system supplies it. As a result, live data creates a dependency that static media does not have.
Static content survives because the asset already exists
A stored image or video is mainly a media problem. Once the approved file reaches local playback storage, the screen can continue showing it until a later asset replaces it. Network access may still matter for remote uploads, but the visible content itself does not need another platform to answer every time the frame appears.
This distinction matters during failure planning. If a network link disappears for a short period, a stored campaign scene may keep working normally. A queue number or current transport status may not.
Scheduled content depends on time, but not always on outside data
A timetable adds another layer without necessarily introducing an external feed. Morning content can switch to an afternoon scene according to the player clock. Likewise, a planned service notice can start and stop at defined times while all media remains stored locally.
In this model, the key question is whether the schedule and clock are correct. Live data creates a harder question: whether the information being shown still represents the current state of the source.
A live value can look healthy long after it has stopped being current
This is one of the easiest risks to miss. A connection failure often looks obvious because a request returns an error. Stale information is more dangerous because it can still look perfectly normal.
A temperature can remain visible even though the weather source stopped updating hours earlier. A transport row can continue showing an old arrival estimate. A price panel can preserve a previous value without any obvious sign that its upstream record has expired. Therefore, live display design needs a concept that static media rarely needs: freshness.
The image or video already exists. Storage and playback determine whether it appears.
Prepared media changes according to a clock, calendar, event window, or other timetable.
The value comes from another information system, so age, validity and failure behaviour matter.
A useful planning shortcut: classify each visible region before discussing software. A permanent logo can stay static. Promotional media can follow a schedule. A queue number can remain live. An approved service message can override all three. This simple distinction keeps the integration discussion focused.
Follow the Data From Its Original Source to One Visible Region
Live information often looks deceptively small on screen. A weather block may contain one temperature and one condition. A queue display may show only a number and counter. Yet those few visible fields can pass through several systems before they become usable.
The easiest way to understand the integration is to follow one value rather than looking at the entire software stack at once. Consider a queue number. The queue platform creates the business state. An interface exposes the relevant record. Another layer checks and prepares the value. The player places it in the correct region. Only then does the final visual canvas reach the LED system.
Time is dynamic, but it may not need an external feed
A clock changes every second, yet it can often be generated locally. In that case, the concern shifts away from an external API and toward clock synchronization, timezone, date format, restart behaviour, and consistency between displays.
This is a useful reminder that “live” does not automatically mean “internet API.” The correct source depends on where the authoritative information already exists.
Weather needs fewer fields than the weather service probably provides
A weather service can expose a large amount of information. The display may need only location, current temperature, condition, icon state and source timestamp. Pulling every available field creates more dependencies without improving the visible result.
Therefore, the better question is not “Can the weather API be connected?” It is “Which weather fields actually appear, and how old can those fields become before the weather region changes state?”
Queue data is a state, not just a large number
Queue information may include a called number, counter, service category, status and timestamp. The number alone does not explain whether it has just been called, remains active, has been completed, or belongs to an old record.
This is where source meaning matters. A blank value should not automatically become zero. Likewise, a missing field should not automatically mean “no queue.” Those states can represent very different operating conditions.
Prices should arrive as approved values rather than being recalculated on the screen
Price information can depend on currency, product identifier, location, effective period, promotion state, unit and other rules. Those commercial rules belong in the source platform that already owns them.
The display workflow can then concentrate on presentation. Decimal places, currency symbols, unit labels, text length and unavailable states can be standardized without duplicating the pricing logic itself.
Traffic and transport feeds often need translation before they need graphics
Transport platforms may expose route identifiers, estimated arrival, platform, delay state, service code or incident status. The raw values may be designed for software rather than public presentation.
Middleware can reduce that complexity by translating internal codes into a stable display model. The player might receive only destination, expected time and approved status text. If the source changes later, the presentation layer can remain largely unchanged.
Decide Which Layer Owns Each Decision Before Software Work Starts
Integration becomes difficult when several systems quietly share the same responsibility. A source application may format display text. A player may start interpreting business status codes. Another script may keep a separate cache. The result can still work during demonstration, yet troubleshooting becomes much harder when something changes.
A cleaner architecture keeps the boundaries understandable. The source owns the business fact. Middleware decides whether the fact is suitable for presentation. The player owns the visual scene. The LED control path owns physical output.
Expose approved records, source timestamps, identifiers and source-side states.
Validate, map, normalize, cache, check age and select the appropriate state.
Place accepted values into regions, combine them with media, and render the visual scene.
Handle the final display output rather than interpreting queue, weather or pricing semantics.
This division also makes project scope easier to discuss. “API integration” can otherwise describe several completely different tasks. It may mean retrieving an external feed, building middleware, mapping data into a player template, or coordinating several dynamic regions inside one physical screen.
When the information architecture influences screen geometry, a Custom LED Display project can coordinate those two sides together. A permanent queue block, weather strip, transport list or multi-zone information canvas may need physical dimensions and software regions to be considered at the same stage.

Fixed Information Screen Format
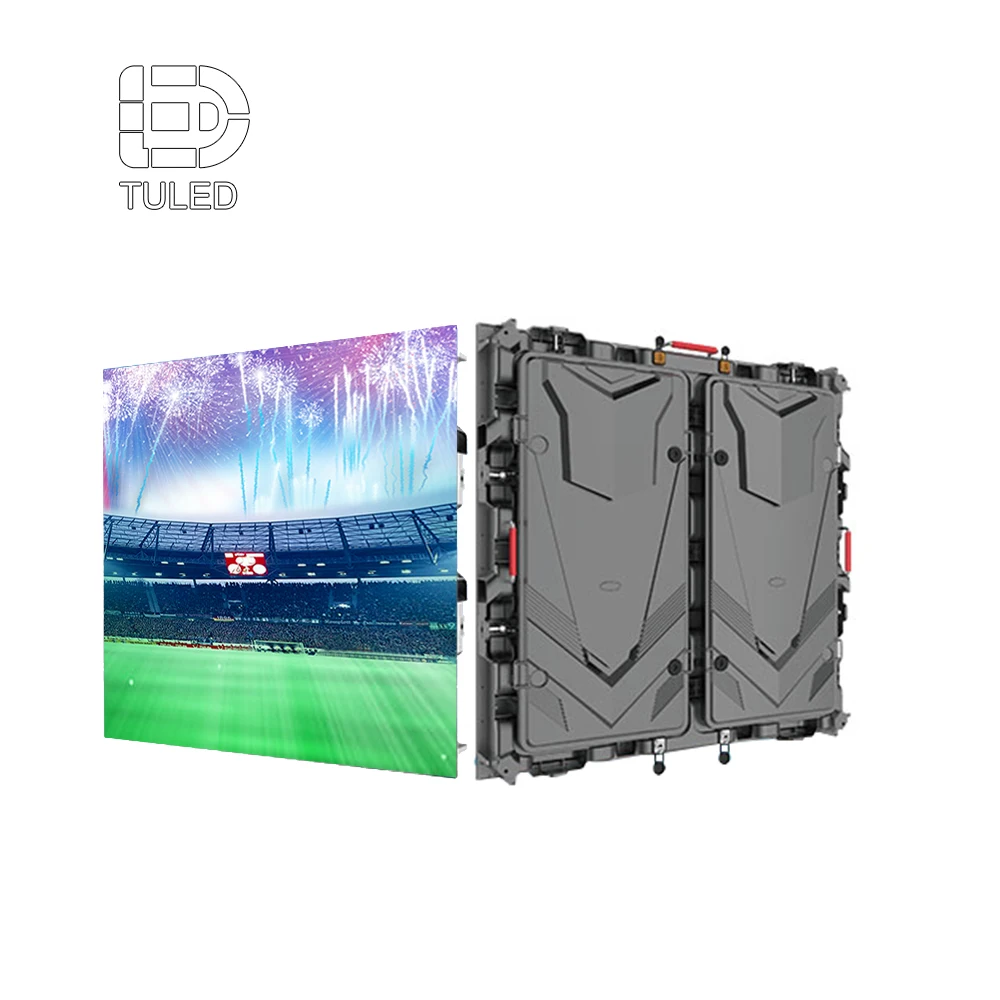
The cabinet is the physical endpoint. Region count, information hierarchy and service access still need to fit the final display geometry.
View 960×960 LED Display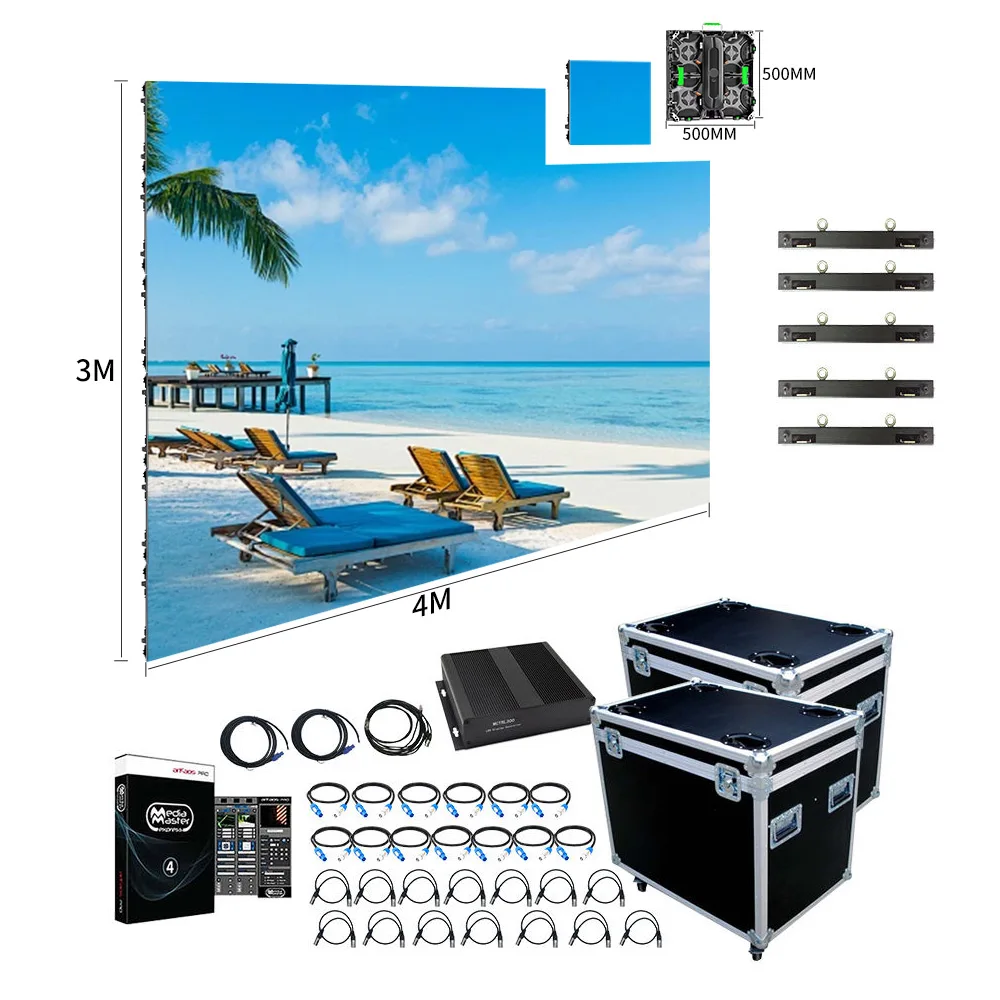
Modular Information Canvas
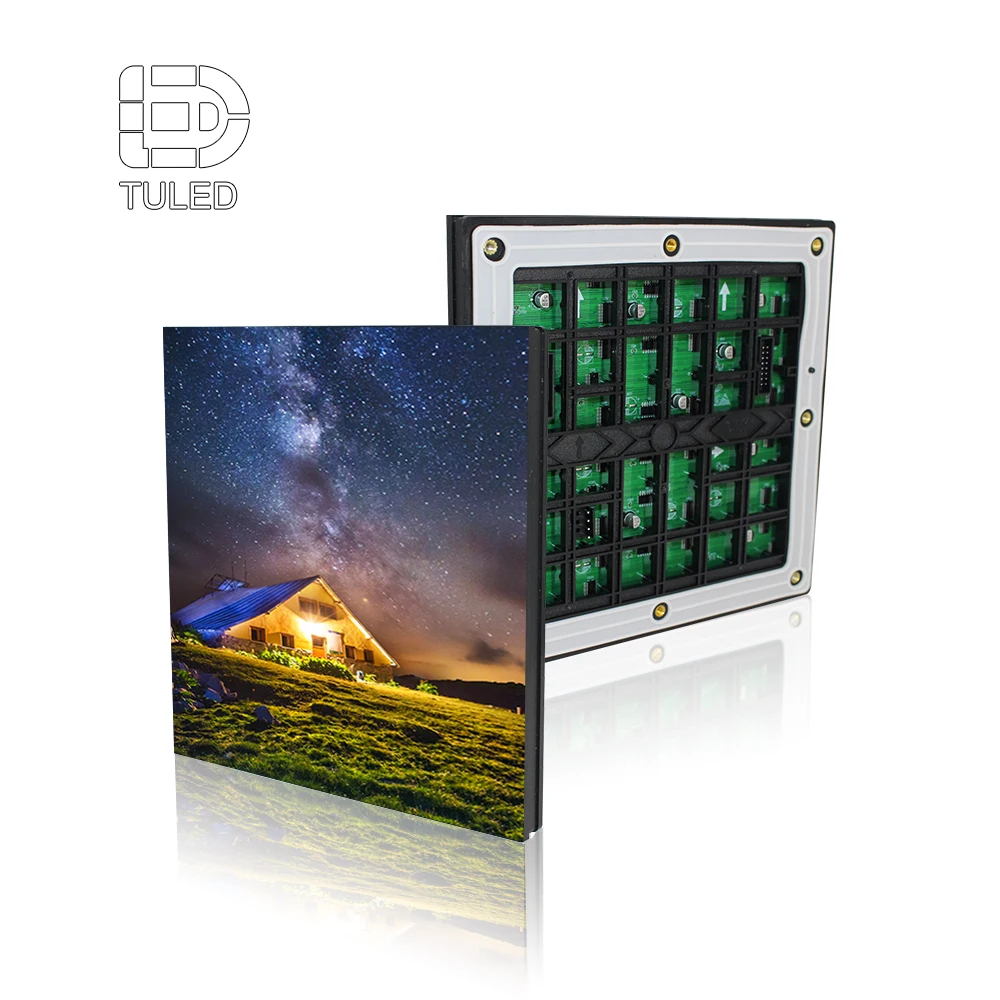
Modular hardware can form different overall sizes, while data regions and fallback behaviour remain defined at the content-system level.
View 500×500 LED DisplayDefine What Each Visible Field Means Before Building the Final Layout
“Connect the weather API” or “show the queue data” sounds clear during an early discussion. In practice, both statements leave most of the important integration decisions open.
The more useful starting point is a small data contract. It connects one visible element to one defined source field and records enough context to decide whether that value can safely appear.
A field name alone rarely explains the business meaning
A property named status could mean service availability, API health, record validity, queue state or route condition. A field named wait_time still needs a unit and a definition.
Therefore, the field definition should capture meaning as well as syntax. This small step prevents a technically correct integration from presenting the wrong interpretation.
Zero, blank and unavailable should remain different states
A queue count of zero can be a legitimate business value. A blank field may mean no active record. A missing key can indicate incomplete data. A failed request means something else again.
Collapsing those states creates misleading output. The display model should preserve the difference until an approved presentation rule decides what each condition looks like.
Text length belongs in the data discussion
Dynamic layouts often fail visually before they fail technically. A destination name that fits during testing may be much longer in normal operation. A service message may wrap into another region. A large price can use more digits than the original mock-up allowed.
Consequently, text-heavy fields need a known visual rule. The project may use an approved abbreviation, wrapping, truncation, another template state, or a different region width. Silently shrinking text until it becomes unreadable is rarely a good fallback.
| Field question | What the integration needs to know |
|---|---|
| Where does it come from? | The authoritative application, service, local system or approved source. |
| What does it mean? | Business meaning, unit, timestamp meaning and allowed state. |
| Is it required? | Whether the region can still remain valid when this field is missing. |
| How fresh is it? | Source timestamp and the maximum approved age for current presentation. |
| What can break it? | Missing value, invalid format, unknown status, old timestamp or unavailable source. |
| Where does it appear? | The exact screen region, formatting rule and expected text length. |
| What replaces it? | Last accepted value, neutral message, local media, hidden region or another approved fallback. |
“Real Time” Is Too Vague Until Refresh and Freshness Are Separated
One of the easiest RFQ mistakes is writing only “real-time update.” The phrase sounds precise but can describe completely different operating expectations.
A queue event may need to appear quickly because the information changes the immediate service flow. Weather data may follow a slower publication cycle. A promotional price can remain unchanged until an approved commercial event occurs. Those feeds do not need identical update behaviour simply because they share one screen.
Refresh interval asks how often the system looks for something new
Polling may check an API at a defined interval. A webhook may deliver a change when an event occurs. Another local source may publish a file or message only when a new record exists.
The update mechanism should follow the source that already exists. Requesting the same weather endpoint repeatedly does not create fresher weather when the provider has not published a new observation.
Freshness asks how old the last accepted value may become
This question is usually more useful. A connection can remain healthy while the source continues returning an old record. Therefore, the screen needs a separate rule for the age of the business information itself.
Once that age crosses the agreed threshold, the system can stop presenting the value as current. This is the point where cache and fallback logic become part of the content design rather than only an IT concern.
How often does the integration request, receive or check for a new record?
How old may the last accepted record become before the screen should stop treating it as current?
Fail-Safe Content Should Degrade the Message Gracefully, Not Hide the Failure
Live information needs a meaningful visual state even when the source disappears. Without one, the screen may freeze on old information, expose an empty text field, show an application error, or simply leave a large blank area.
The strongest fallback is rarely a single emergency screen. A better design allows the information to degrade in stages. Short interruptions can retain the last accepted record. Older data can move into a stale condition. Finally, a neutral local scene can replace information that should no longer be presented as current.
Cache the last good record, not simply the last response
A malformed response should not overwrite the only reliable local record. Instead, new data can pass validation before it replaces the cache.
The sequence is simple in principle: receive the new record, check it, normalize it, accept it, then update the stored last-known-good state. When a new response fails those checks, the valid cache remains available until its approved age expires.
One failed feed does not have to destroy the whole canvas
A mixed information screen may contain weather, time, queue data and scheduled media. If the weather feed fails, the queue platform may still be healthy and the local media may still be available.
Region-based fallback can preserve the useful parts of the screen. The weather zone changes state while the queue region continues updating. This produces a more controlled result than replacing the entire display because one external source became unavailable.
A believable substitute can be worse than an unavailable message
Default information should not invent a plausible value. A made-up temperature is still wrong. Zero should not replace an unavailable queue state unless zero genuinely has that business meaning. An old price should not remain indefinitely just because it still fits the layout.
Neutral fallback content is usually safer. Depending on the application, the region may show general service information, a static location panel, an approved unavailable state, or another local scene that remains valid without the external feed.
Recovery deserves its own rule
When the source returns, the first response should not automatically erase the fallback state before normal checks run. The new record still needs to meet the same field and freshness rules as any other live update.
This becomes especially useful when an upstream service is unstable. Otherwise, the visible region can repeatedly switch between fallback and live content while the source connection fluctuates.
A Better RFQ Describes the Information Flow, Not Just the Screen Size
Screen width, height and installation conditions remain essential. However, they cannot explain whether the finished canvas contains one clock or six independent live feeds.
The integration brief becomes much clearer when it answers three practical questions: what information enters, how quickly it can change, and how many parts of the screen depend on it.
Start with the source, not the software brand
Each live information type should have a known source. It may be a queue platform, weather provider, internal price database, traffic service, transport system or another approved business application.
The early brief can then state whether interface documentation already exists and whether the available route is REST API, webhook, local service, message stream, structured file or another confirmed method. If the method is not known yet, keeping that item open is better than guessing.
A small sample payload can answer several questions at once
A sanitized sample can show field names, data types, timestamps and status structure without exposing production credentials or confidential records. This often reveals more useful information than a long general description of the platform.
For example, a queue payload that contains a service code, queue number, counter, status and update timestamp immediately shows which fields may need mapping and which values affect the visual state.
Region count changes the integration scope
A full-screen weather scene is comparatively simple because one source owns most of the changing content. A mixed display can be different. Time may run locally, weather may come from an external provider, queue information may come from an internal platform, and scheduled media may occupy the remaining space.
Therefore, the number of independently controlled regions belongs in the RFQ. Each region can then be connected to its own source, update behaviour, fallback state and visual priority.
The RFQ does not need a software specification. It needs these decisions.
Test the Uncomfortable Data States Before the Screen Goes Live
Perfect sample data proves that the layout can render. It does not prove that the information system can fail safely.
Integration testing becomes more valuable when it deliberately breaks the assumptions behind the normal scene. A required field can disappear. A status value can become unexpected. The API can remain reachable while its timestamp stops changing. The feed can disappear long enough for cached information to become stale.
Long but valid text also belongs in testing. A destination with more characters, a larger price, or a longer status message can expose visual problems that short development values never show. Those tests are simple, yet they often prevent more visible failures than another round of normal-data screenshots.
FAQ
What is the real difference between a live-data LED screen and ordinary scheduled playback?
Scheduled playback normally selects prepared media according to time. Live-data content depends on values created elsewhere, so the display workflow also needs to decide whether those values are valid and current. The main difference is not visual animation. It is dependency on an external information state.
What should the API, middleware, player and LED control system each do?
The source or API should expose the authoritative information. Middleware can validate, normalize, cache and judge freshness. The player turns accepted values into a visual layout. The LED control path then delivers the finished visual output to the display hardware. Some platforms combine several functions, so the final boundary still needs project confirmation.
When should refresh frequency be confirmed for weather, queue, price or transport feeds?
The decision should be made before integration scope and acceptance testing are finalized. Source update behaviour and maximum acceptable data age should be discussed separately because they solve different problems. Different regions on the same screen may also need different update policies.
What should happen when the external data source stops updating?
The last accepted record can remain only while it is inside its approved freshness period. After that point, the affected region can move to neutral fallback content. Other healthy regions can continue normally. When fresh data returns, it should pass normal validation before the live scene resumes.
What information is most useful during the quotation stage?
The strongest starting brief identifies each source, known interface method, required fields, expected update behaviour, acceptable data age, number of dynamic regions, fallback requirement and available sample payload. Network location and test-access status can also help define the integration boundary before detailed software work begins.
The Best Live-Data Screen Keeps Business Logic Upstream and Presentation Clear
A queue platform should continue deciding queue state. A pricing platform should continue owning prices. A transport application should continue owning transport information. The display does not become more reliable by copying those business rules into every player.
Instead, the integration can extract only the information required for presentation, decide whether each record is still suitable to show, and pass a clean display model downstream. This separation also makes later changes easier because the screen layout does not need to understand every detail of the upstream system.
Before quotation, three decisions create the clearest starting point:
- Map the live regions. Record which source and fields drive each visible area.
- Define age as well as update speed. A successful connection does not prove that the displayed information is still current.
- Design the fallback before the live feed is connected. Cache duration, stale state, neutral content and recovery should not be improvised after deployment.
Prepare the data-source brief before integration review
Submit the type of data source, available API or interface documentation, required fields, expected update frequency, acceptable data age, and the number of independently controlled screen regions.
Where available, add a sanitized sample payload, region mapping, network location, cache requirement, fallback scene and recovery rule. These details make it possible to review a custom led display board as an information-system endpoint rather than treating the project as a generic request for API connectivity.
Submit Data Integration Requirements