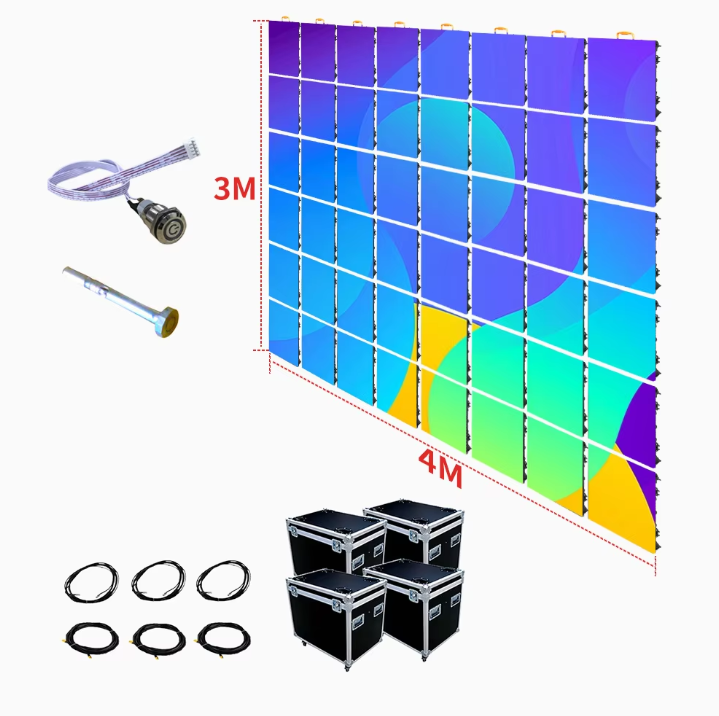
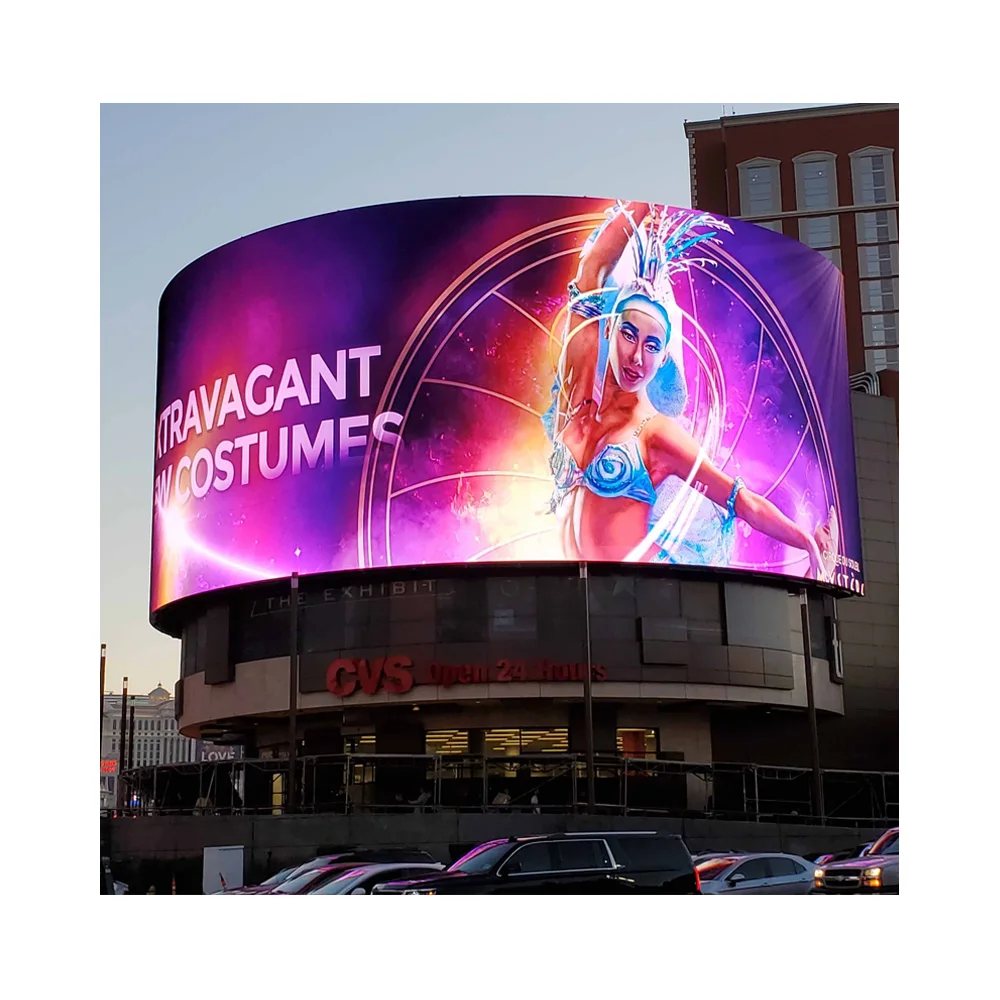
Стадионски Џумботрон је инфраструктура. Он носи репеле, време, статистику, спонзорске петље и безбедносне поруке кроз сунце, кишу, ветар и тешке календаре догађаја. Квалитет слике је и даље важан, али време рада, приступ сервису, топлотни простор за главу и отпорни синџир сигнала обично одређују да ли се плоча осећа "премијум" током целе сезоне. Лед зидни панели олакшати превод бројача на цртежу у ормаре, модуле, зони енергије и планирање резервних делова.
У сред летње поподне, сјај и топлота могу срамнити контраст и изазвати топлотну засицање у најгорем тренутку. У други викенд, један неуспех излазног порта може створити зацрвеност пола екрана, осим ако се резервност и зонирање нису планирали око стварних начина неуспеха.
Кључне ствари
Величина треба да прати страну погледа и решетку фиксног садржаја, а не дијагоналу циља.
Пикселни пич је одлука о радном теку колико и визуелна одлука; превише резолуције повећава мапирање и оптерећење садржаја.
Циљеви за спољашњу употребу (светлост, ИП стратегија, термички дизајн) треба дефинисати као опсеге плус кораци верификације.
Џумботрон је систем: обрада, транспорт, пријем хардвера, праћење и документација покреће стабилност догађаја.
ФАТ/САТ контролне листе и понављајући план одржавања одржавају површину равномерном након поправке.
Шта треба да покаже стадионски џумботрон
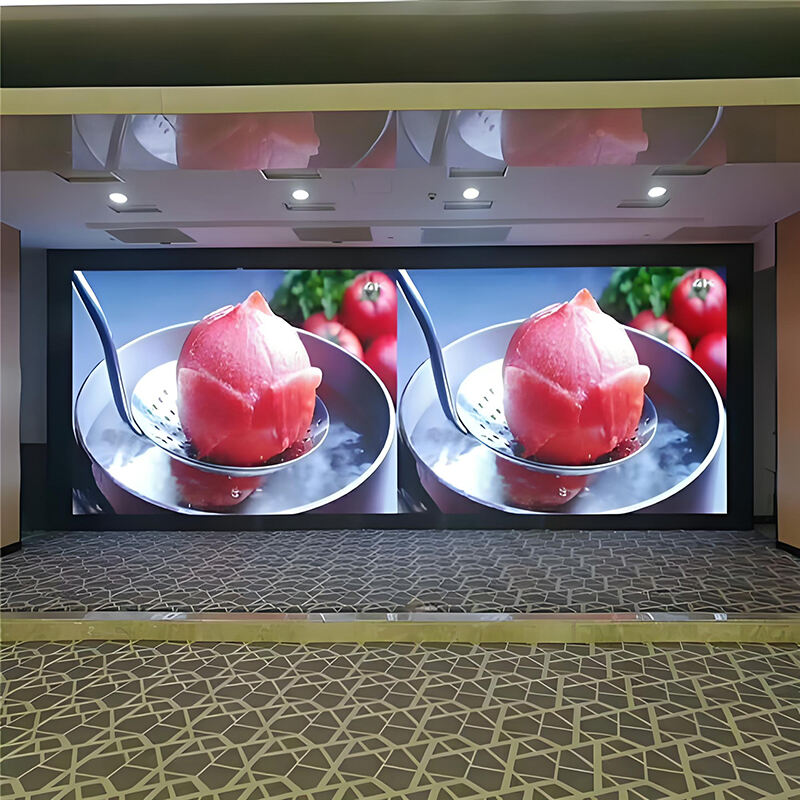
Стадионски дисплеј ретко ради један посао. Поновно приказивање, часовници, ротација спонзора, подстицања и хитне поруке су на истом платну под променљивим светлом. Захваћање емитовања такође "види" питања другачије од гледалаца, тако да би се стабилност која се односи на камеру требала третирати као основни захтев.
Читалост гледаоца и стабилност емитовања
Геометрија седишта ствара широк распон гледања. Горње палубе зависе од табле за информације. У доњем делу се налазе шви, структура пиксела и артефакти кретања. Извештај додаје још једно ограничење: понашање скенирања и стабилност обнављања могу створити траке или треперење на камери чак и када седнице изгледају прихватљиво.
Практичан начин размишљања о планирању одваја "поновљени утицај" од "читавости информација". Поново репродукције могу да подносе више нејасности и маштања покрета. Сатима, резултатима и подстицајима не може.
Pravilo projektovanja: Ако репеи изгледају снажно, али је сатима тешко читати са даљњег опсега, мрежа је погрешна, чак и ако је ЛЕД хардвер одличан.
Оперативно време и брз опоравак
Оперативни тимови мере успех по времену рада и брзини опоравка. Модуларна површина која се може брзо поправити често надмашује површину са високим спецификацијама која је тешко приступачна. Услужне траке, резервна стратегија и мапирање грешака одређују време опоравка, а не маркетиншке услове.
Календари догађаја сузбијају прозоре за одржавање. Кратки сервисни прозорец захтева радне токове са примарним приступом, јасно означење кабинета и контролисан поступак за размену модула, напајања и прихватања хардвера.
Систем, а не куповина само за кабинете
Кабинети су важни, али "свршени" резултат зависи од система око њих: обрада, скалирање, прелазак, дуготрајни транспорт, синхронизација, праћење и документација. Одлуке система у касној фази обично стварају скупе решења у последњем тренутку.
Страница каталога која чува кабинете, процесоре и пријемни хардвер видљиви на једном месту помаже у избегавању фрагментисаног планирања: Каталог производа за ЛЕД екране .
Ограничавање екрана: од визуелних линија до решетка садржаја
"Већи" није метод за одређивање величине. Поуздана величина долази из видених линија, информационе мреже и функционалне структуре.
Поделите место на групе за гледање
Једина "просечна удаљеност" крије стварност. Погоднија подеља је:
Блиски опсег: блиска седишта и стрми углови који откривају шавове и пикселну структуру
Средњи опсег: типична зона за повратне приказивање и статистике
Даљи опсег: горњи палуб где се дебело читање и контраст носе искуство
Свака трака даје другачији нагласак дизајну. Читаност у даљем опсегу је обично најтежи захтев за испуњење.
Лоцирајте мрежу садржаја пре завршних димензија
Фиксирана мрежа спречава хаос у распореду дана догађаја. Резервише некретнину за репрограму, сат/порезу, кључне статистике и спонзорске кадре без смањења основних информација током ротација.
Уобичајени образац мреже укључује:
Главни прозор за репрограму (често 16:9)
Постојан опсег података за сат и резултат
Статистички модули за кључне информације (шутови, фаули, посед, итд.)
Модули за ротацију без кретања елемената језгра
Безбедне маржине које штите читавост у стрмим угловима
Дисциплина у мрежи такође побољшава конзистенцију спонзора. Када спонзорски оквири не боре се против буба, оператери престају да импровизују.
Упутство за оператера: Ценност спонзора пада када се преклапања померају, мењају величину или померају током игре. Стабилна мрежа одржава предвиђање места.
Структура и приступ третирају као део size
Квадратни метри додају тежину, оптерећење ветром и сложеност приступа. Контрола конструкције одвијања шваба шваба шваба шваба шваба шваба шваба шваба шваба шваба шваба шваба шваба шваба шваба шваба шваба шваба шваба шваба шваба шваба шваба шва Планирање приступа штити време рада.
Структурно планирање треба да изричито обухвата:
Пут ветра и сеизмичког оптерећења (у складу са локалним кодом)
Дизајн тачака за причвршћивање и хардвер за оптерећење
Ограничења дефикције која штите распоред кабинета
Платформе за приступ, ограде и безбедне радне зоне
Пут кабела који остају доступни након инсталације
Контролна тачка инжењерства: Ако се одвијање не контролише, шви се одвоје и постају видљиви током светлог, равномерног садржаја.
Кратког величине радног потока који остаје заземљен
Поуздан проток димензирања држи одлуке конкретним:
Картирајте линије вида и дефинишите примарну зону читаљивости.
Дефинишите мрежу са садржајем са стварним величинама шрифта и безбедним маргинама.
Изаберите однос облика који одговара потребама за репродукцијом и информацијама.
Прерадите физичке мереоце у пикселово платно користећи тачку.
Проверите структуру, приступне руте, рутинске траке и капацитете контролера.
Овај редослед смањује ризик од избора драматичне величине прво, а затим и резања функционалности касније.
Пикселни пич и резолуција: Практична правила која остају корисна
Пикселно растојање није трофеј. То је избор буџета, радног тока и одржавања који обликује читав дизајн сигнала и услуге.
Правила за брзо пич-да-дистанцију за рано планирање
Правела не су стандарди, али спречавају рано несагласност:
Тешки текст, фина линија и стрми угао гледања повећавају удобну удаљеност. Обухват који се игра више је опростивији.
Таблица за рендарирање водича за блиске/средње/далеке опсеге
Следећи табела је намерно широка. Помага у раним дискусијама о избору и планирању буџета, а затим се рафинише са линијом погледа и шаблонима садржаја.
| Седећа лента |
Типична употреба на дан догађаја |
Шта мора да изгледа најбоље |
Практичан правц наклона (надвор) |
| Блиски опсег |
Поновно пуштање, тимска графика, блиска перцепција шавова |
Контрола шава, јасноћа покрета, униформитет |
Финији танац помаже, али приступ сервису и даље је важан |
| Средњи опсег |
Поновно пуштање + читави статистички подаци |
Убалансирана јасноћа и сјајност |
Средњи домет често је најбољи однос трошкова и користи |
| Далеки опсег |
Сатима, резултатима, великим подстицањима |
Дебел текст, висока контрастност |
Грубији уздиг може радити ако су шаблони јаки |
Мешанско место за приказивање је уобичајено. Конкорс и контролна подручја често оправдавају финији пич, док главна стадионска ЛЕД видео табла има користи од прагматичног пича плус јаке сјајности и униформизма.
Резолуција мења систем, а не само слику
Повећање више пиксела:
Нагружање излаза контролера и сложеност планирања луке
Пријем рачуна хардвера и мапирање радног оптерећења
Време пуштања у рад (изређивање + калибрација + мапирање)
Намет производње садржаја за сваки догађај
"Скривена цена" је задовољство. Пленка са високом резолуцијом и даље изгледа меко ако су извори често повећавани или слабо деинтерласирани. За тимове којима је потребно поновно размишљање о избору пиксела, овај водич је корисна референтна тачка: Најбољи димензија пиксела за дисне диснее са малим пичем .
Перформансе усмерене на камеру: стабилност освежавања и понашање сиве скале
Прихваћање емисије често открива појасу и скенирање артефакта пре него што их гледаоци примете. Језик набавке је најјачи када се фокусира на резултате:
Стабилно, пријатељско понашање за освежавање камере
Глатка перформанса сиве скале са минималним тракама
Уједначено калибрирање преко ормара и модула
Једноликост је често одлучујући фактор на великим платнама. Добро калибрирана површина са чврстим контрастом често чита "оштрије" од површине веће густине са непостојећим шавовима или дрјевећом сјајност.
Циљеви на отвореном: светлост, одражавање, ИП стратегија и трајност
Учинци на отвореном треба да буду описани као опсег плюс кораци верификације. То оквиршавање одржава планирање реалистичним и тестираним.
Циљеви за сјај у гнидима
Многе апликације стадиона на отвореном планирају у 5.000–8.000 nits , у зависности од оријентације локације, излагања сунцу и угла екрана. Виша сјајност може помоћи у екстремном сунчевом светлу, али повећава потражњу топлоте и енергије. Контраст, анти-облачење површине, и калибрација конзистенција и даље одлучују да ли садржај изгледа оштро.
За шири преглед категорије ванземаљских производа који се користе у свим апликацијама, ова страница помаже у огледалу типичних очекивања осветљености и водоотпорности: Вонрешњи ЛЕД дисплей .
Озрак и одраз
Глере је тихи убица спонзора. Огледали могу да преморе светле позадине и да смање јасноћу подновља по обеду. Дизајн маске против сјаја и дисциплина шаблона помажу у смањењу перцепције прања.
Ствари за дизајн обрасца:
Користите дебелу типографију и јасну хијерархију
Резервирање доследних сигурносних маржина за критичне информације
Избегавајте фине линије и невидљиве градијенте за читање у даљем опсегу
Пољска напомена: Поподневни блиц често најпре повређује спонзорске модуле јер те зоне користе светле позадине и покретну анимацију.
ИП оцена и стварна конструкција запломбе
Заштита извозника је више од ознаке за оцену. Пројекат обично има користи од:
Чисте циљеве предње заштите од прашине и кише
Заштита конектора и штитња улаза кабела
Дизајн дренажних путева и управљања водом
Документација о процедурама сервиса које очувају печате
За опис очекивања за заштиту ванземаљске зоне усмерен на апликацију, ова страница је практична интерна референца: Vanjske LED ploče .
Механичка издржљивост: ветар, вибрације и корозија
Напреза ветра утиче и на безбедност и стабилност шваба. Вибрација може временом олакшати хардвер ако системи браве нису чврсти. Приобаљна средина додаје ризик од корозије која утиче на фиксације, коннекторе и кабелне јакне.
Трајни план укључује:
Структурна ревизија усклађена са локалним кодовима
Избор материјала који је осетљив на корозију, ако је потребно
Планирање безбедности приступа (платформе, ограде, номиналне подизачке тачке)
Инспекциони каданс који одговара озбиљности климе
Радни пример: Из метара → пиксела → ормара → контролера портова
Рађени пример претвара концептуалну дискусију у контролну листу планирања. Следеће бројеве илуструју процес и логику, а не одређено обећање бренда.
Корак 1: Дефинишите реално величину плоче
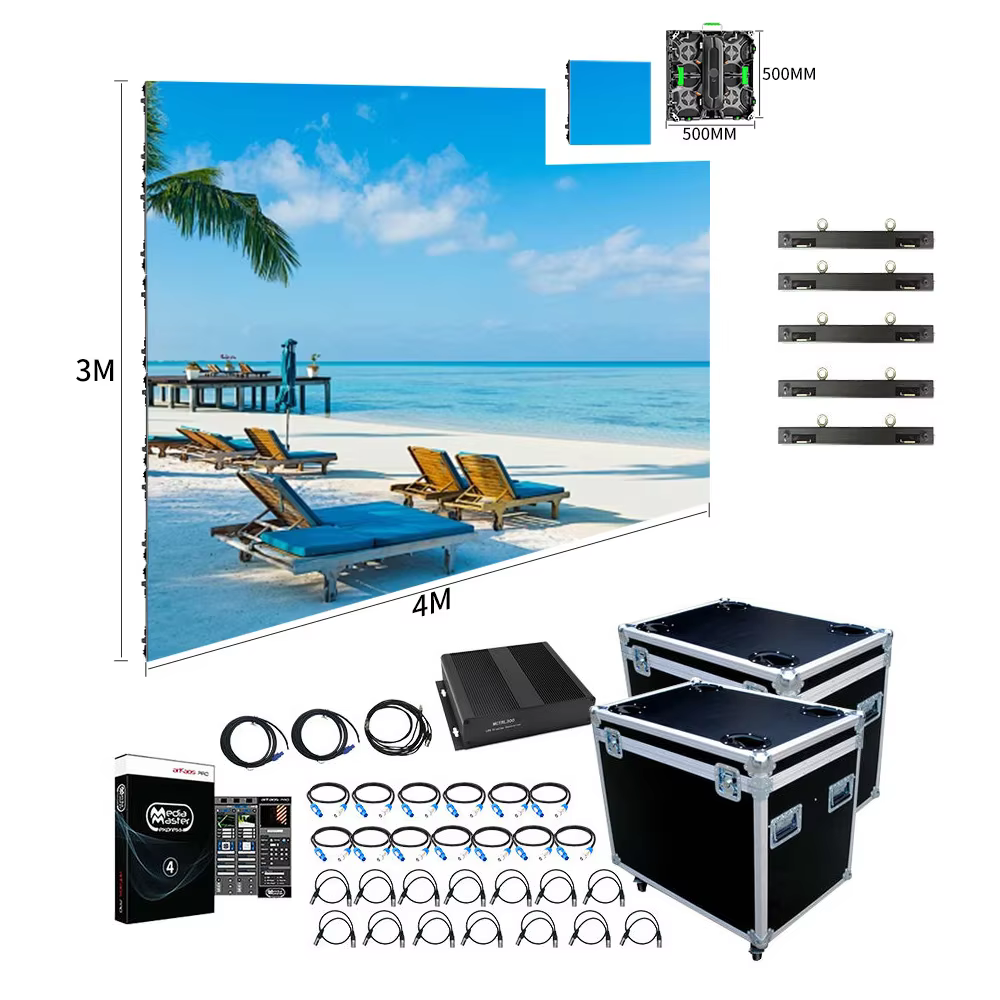
Претпоставимо концепт главне плоче са 16:9 платно:
Ширина: 20,0 м
Висина: 11,25 м
Ова величина подржава велики прозор за репрограму и структурисани информациони опсег.
Корак 2: Изаберите пич за пример и конвертирајте у пикселе
Користите плански пример 8,0 мм .
Преобраћај метара у милиметре:
Ширина: 20.000 mm
Вишина: 11.250 mm
Поделити по низи:
Укупни пиксели:
Тај број је већ довољно велики да капацитет контролера и планирање лука постају примарни покретачи дизајна.
Корак 3: Додајте простор за главу и капацитет контролера плана
Велика платна имају користи од планирања простор за редукцију и мапирање дисциплине. Практичан прстен за простор за главу је 15–25%- Да ли је то истина? Са 20% простор за главу:
Избор контролера затим следи капацитет плус оперативне потребе:
Број излаза и организација луке
Способност складиштења и обнављања резервних копија мапирања
Стабилност у условима промена формата и преласка
Контрола видљивости током рада
Страница категорија која објашњава шта видео процесор ради у смислу система може подржати ову фазу планирања: Видео процесор - Да ли је то истина? Пример конкретног процесора такође може бити користан када се усклађују типови улаза и концепти мапирања: Новастар VX400 видео процесор .
Корак 4: Преведите пикселе у ормаре и сервисне зоне
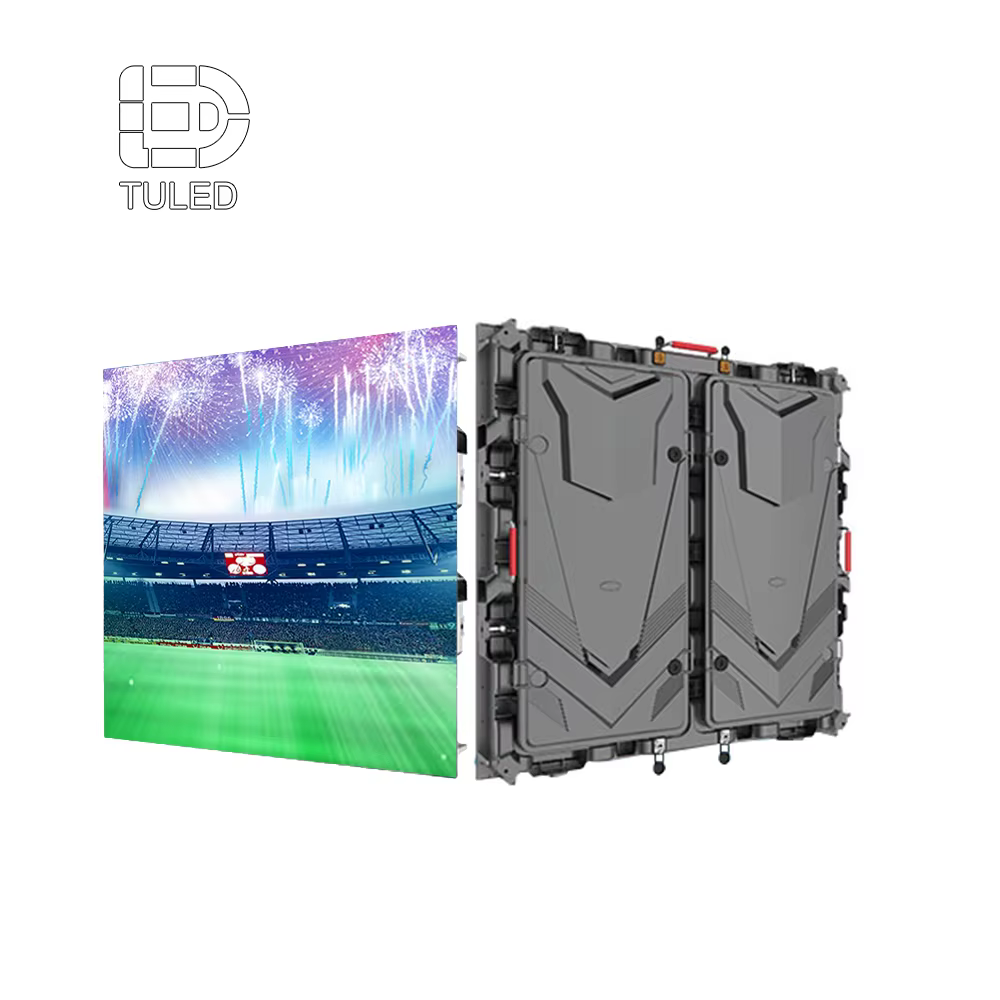
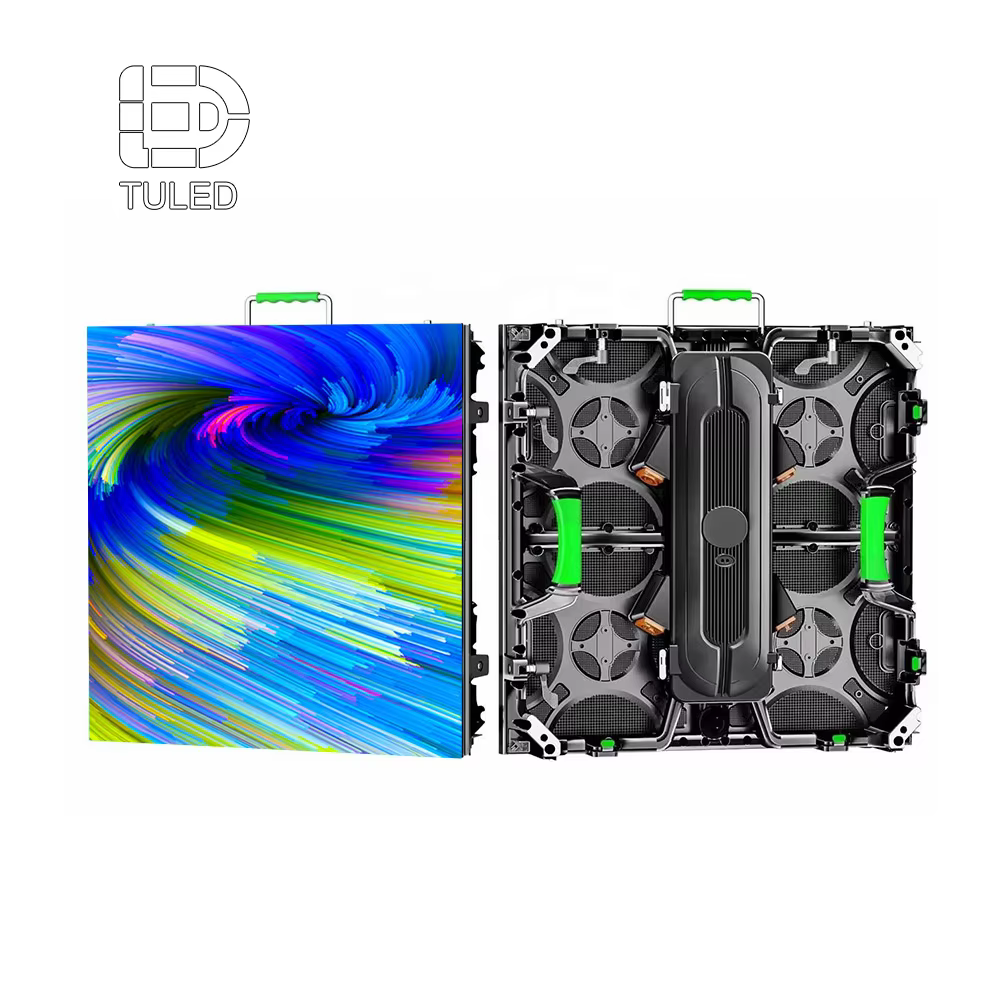
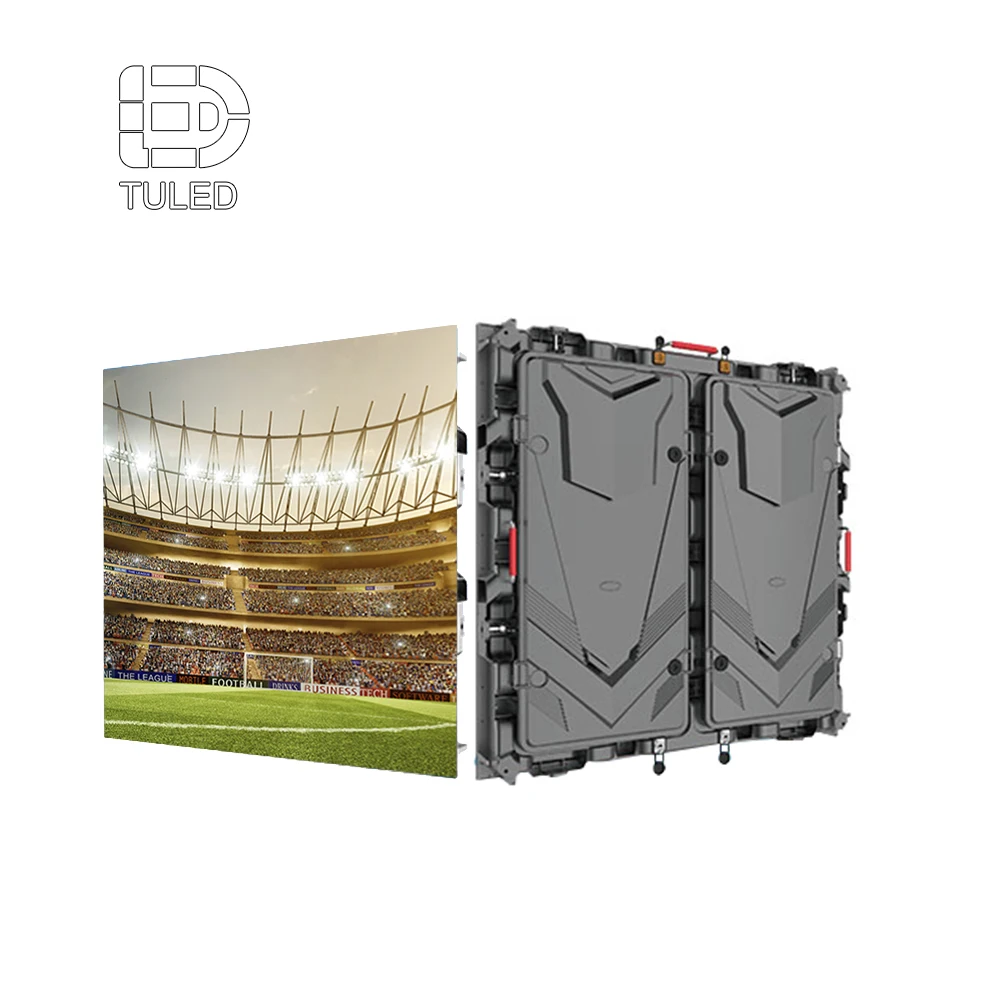
Величина ормара дефинише физичку мрежу. Многи напољу плоче користе стандардизоване форматске ормаре јер поједностављају структуру, резервне делове и процедуре сервиса. Пребројка кабинета затим води:
Зоне за дистрибуцију енергије
Пут за рутирање података и мапирање порта
Планирање резервног модула
Проектирање сервисне путеве и планирање опреме за приступ
У овој фази, Лед зидни панели боље се третирају као грађевински блокови, а не као екран. Формат кабинета и метод сервиса одређују колико брзо се грешке чисте.
Корак 5: Вежите физичку мрежу са ограничењем прекида
Силни дизајн система има за циљ грациозан неуспех:
Једнократни прекретни пут не би требало да зацрни цело репејл канало.
Једини неуспех у извозу не би требало да убије половину екрана.
Једно повреда пријемног хардвера треба изоловати на малу површину.
Инжењерска контролна тачка (2/4): Ако мапа контролера не одговара плану физичког приступа, опоравак постаје споро током догађаја.
Сила, топлота и понижавање квалитета: Шта заправо не функционише у летњим дневним играма
Многе "мистеријске грешке" су енергетске или топлотне грешке. Дневне игре су најтежи тест јер сунчева светлост, топлота и висока сјајност захтевају врхунац стабилности.
Типични опсегови снаге и шта их мења
Моћ се разликује по сјају, садржају, низи и дизајну ормара. Ипак, рано планирање често користи широке опсеге:
Светло бело мастило повећава ниво. Тёмни садржај смањује просечно. Место одржавања које води спонзорске петље са светлим позадинама може видети већи трајни просечни оптерећење од места са тамнијим графичким пакетима.
Стратегија зонирања за спречавање потпуног прекида струје
Појам снага треба да ограничи утицај повреде или недостатка снабдевања. Корисни принципи зонирања укључују:
Поделите језгро реплеја и опсеге података у различите зоне
Стаггер зоне тако да прекид не уклања континуиран блок преко центра
Означите зоне тако да је изолација грешке брза
Успореди зонирање са физичким приступом тако да се процедуре сервиса буду безбедне
Планови зонирања који не успевају грациозно штите континуитет догађаја чак и под грешкама.
УПС и генераторски интерфејс
На неким местима се од одбора захтева да прође кроз кратке прелазе. Други дозвољавају контролисано поверење. Планирање питања која смањују изненађења:
Који делови ланца захтевају заштиту УПС-а (процесори, рутери, мониторинг)?
Колико дуго би контролни слој требало да остане жив током преноса?
Који је редослед рестартовања ако се током догађаја покрене струја?
Дефинисана секвенца смањује стрес оператера. Такође спречава одлазак конфигурације након непланираног рестартовања.
Тхермални простор за главу и смањење осветљености
Изванредни ормари живе у топлотној кутији. Сунце додаје више топлоте. Ако је топлотни простор за главу танки, смањење осветљености се обично појављује током највидљивијих дневних догађаја.
Трплив топлотни план укључује:
Презумпције о максималној температури окружења
Претпоставке о директној изложености сунцу
Повођење деретирања напајања
Ограничења проток ваздуха иза екрана
Прагови за праћење и аларми повезани са стварним корацима акције
Инжењерска контролна тачка (3/4): Ако је топлотни простор за главу слаб, слаба осветљеност се појављује током дана на којима је посетилац најчешћи.
Стратегија за заштиту од претераних претерања и заземљавање
Инфраструктура на отвореном треба да буде планирана. Ризик од муке и прелазак транзиторних уређаја могу оштетити осетљиву електронику. Практични план обично укључује:
Заштита од претераних претера на кључним дистрибутивним тачкама
Обличење у складу са електричним кодом
Документисана места за заземљавање за инспекцију и верификацију
Овај рад није видљив на први дан, али често одређује дугорочну поузданост.
Ланцуг сигнала, обраду, пријемне уређаје и праћење
Чиста слика зависи од чисте ланце. То такође зависи од способности да се брзо дијагностикују грешке.
Практичан синџир стадиона
Типични синџир сигнала укључује:
Камере, сервери за реплеј и графички мотори
Прелазак или рутинг (СДИ или ИП видео, у зависности од радног тока локације)
Преобраћај ако је потребно (мање)
Видео процесор/контролер за скалирање, мапирање, синхронизацију
Дуготрајни транспорт, често влакна за удаљеност и имунитет на буку
Примање хардвера који дистрибуира податке на кабинете и модуле
Када је ланац превише сложен, грешке је теже изоловати. Када се конверзије сведе на минимум, стабилност се побољшава.
Реднантност која одговара реалним режимима неуспеха
Редунантност треба планирати по режиму неуспеха:
Резервни улазни подаци из рутирања/преласкања
Припремност процесора за буџетску употребу са сачуваним резервним копијама конфигурације
Дизајн путних подака који ограничава величину прекида
Зоне снаге које спречавају зацрњење читавог екрана
Тестање чини излишљивост стварном. Без испитивања, излишност је нада.
Пријем хардверских и калибрационих разматрања
Пријем хардвера утиче на стабилност мапирања, видљивост мониторинга и проток рада калибрације. Страница са прегледом карте за пријем помаже у орамјевању улоге хардвера за пријем и заједничких карактеристика које се користе у модерним конструкцијама: Примачка картица .
Квалитет калибрације се приказује као:
Глатке рампе у сивом размаку без трака
Успоставна сјајност преко ормара
Стабилан изглед боје у различитим сезонама
Смањена видљивост зашива током светлости
Документација треба да сачува основне линије калибрације и извоз картирања. Ови фајлови постају "заштита" током поправке средине сезоне.
Мониторинг који смањује МТТР
Мониторинг смањује време за поправку када су аларми прихватљиви. Корисно праћење укључује:
Статус луке и здравство кабинета
Аномалије у зони снаге
Температурни аларми повезани са стварним оперативним корацима
Уколико је потребно, примењује се код оператора.
Извоз дневника за дијагнозу након догађаја
План за праћење који производи сталну буку је контрапродуктиван. Планирање са јасним праговима гради поверење.
Планирање инсталације: монтаж, приступ, дисциплина кабла, пуштање у рад
Квалитет инсталације може учинити да исти хардвер изгледа боље или горе. Стварни план инсталације штити квалитет швака и будућу сервисност. Лед зидни панели као систем који се може одржавати (не само површина), приступне стазе, рутинга каблова и опоравка грешака постају много лакше стандардизовати.
Приступ монтаже: зид крајње зоне, централно вешано, фасада
Сваки стил монтаже има предвидиве компромисе:
Стенска фиксација крајње зоне: често једноставнији приступ и рутирање
Центарски: најбоља видљивост, већа структурна сложеност
Фасада/надворна површина: јака присутност, најтежак излагање
Планирање приступа треба да буде одлучујући фактор. Ако рутинске поправке захтевају сложене поставке лифта, повећава се време одсуства.
Предња услуга против задње услуге
Предња служба смањује потребе за задњом пролазом. Задни сервис може бити ефикасан када постоји простор. Прави избор зависи од ограничења места и планирања безбедности.
Планирање за прву услугу треба да се бави:
Упутства за излазак алата и модула
Безбедне радне зоне и платформе
Процедура поновљивог замена која очува печати
Заштита од оштећења током честа приступа
Дисциплина кабелног рутинга
Кабелна рутинга треба да остане одржавана након инсталације:
Ознака која одговара документима за мапирање
Услужни колачи који избегавају напетост спојника
Погоне за рутинге за енергију и податке, где је то могуће
Приступачне стазе се чувају слободне након изградње
Када је рутинг чист, решавање проблема је брже и сигурније.
Увод у рад у реалним условима
Постављање у рад ствара окончену изгледу:
Проверке усклађености и инспекција швака под светлошћу
Калибрација за сјај и јединство боје
Проверка мапирања, скалирања и пребацивања извора
Базни параметри сачувани за референцу одржавања
Тестови обрасци су корисни, али прави видео открива стварне проблеме. Упорука треба да укључује покрет у стилу реплеја, петље спонзора и стварни распоред резултата.
Проверна листа за брзо пуштање у рад (6 провера)
Пре предаје, проверите ове 6 проверки како бисте потврдили да је екран спреман за садржај у дан утакмице.
Шва и равнање: покушајте да у потпуности уградите бело/сиву и кретање климова како бисте ухватили видљиве швије или степенице висотине плочица
Мапирање и скалирање: проверити обрасце тестирања, пребацивање извора и скалирање према коначном распореду
Неисправан прелаз: одвојити један кабел сигнала или онемогућити један порт да потврдите планирани резервни пут држи дисплеј стабилан
Енергија и топлота: проверите зоне снаге, а затим покренути садржај високе сјајности довољно дуго да потврдите ваздушни проток и температурно понашање
Једноставност: потврдити конзистенцију сјаја/боје (без измењавања нијансе, ленти или неисправности угао-у средину)
Заступни и предавање: извоз мапирања + калибрације + белешка о фирмверу, и сачување основне конфигурације за будуће одржавање
Стадионска плоча је изграђена од модула. Дизајн ормара утиче на стварне операције: равнаност контролише швове, интегритет браве контролише дугорочно усклађивање и контрола приступа сервису контролише време простора.
Уравњавање формата са сценаријама спречава присиљавање једног типа ормара да се носи са свим ограничењима.
На великим платнама се види да се у количини разликује. Практична стратегија резерва чини:
Поправка која одржава једноставност је боља од поправке која уводе пачићне степенице осветљености.
Временска линија смањује конфузију. Такође јасно показује шта се мора одлучити раније, а шта се може побољшати касније.
Тестирање прихватања фабрике смањује ризик на локацији тако што рано открива проблеме. Такође производи исходно податке за касније решавање проблема.
Предвидива каденца одржава површину конзистентном и смањује дриф.
Контролне листе треба да буду корисне. Свака точка треба да има јасну дефиницију успјеха/пропасти.
Процес проласка/проласка треба мерети по видљивој области прекида и времену опоравка.
План одржавања треба да смањи МТТР и заштити униформитет након поправке.
Правилна количина зависи од густине догађаја и прихватљивог времена за обнављање визуелне савршенства.
Јасно мапирање претвара стресну грешку у контролисан поступак.
Калибрација није једнократна. Практична каденца укључује:
Конзистентност током сезона често зависи од овог каденца.
Мониторинг смањује време за одлазак када се аларми могу активирати. Корисни аларми укључују:
Дисциплина је важна. Превише упозорења постаје бука; јасни прагови постају поверење.
Циљ је ограничење. Добро уређени систем слабије пропада.
Често је исправка комбинација дисциплине шаблона и контроле осветљења површине, а не само "више гнида".
Овај проблем је лакше спречити него да се касније "избаци".
Термални простор за главу је обично кривац. Управљање топлотом, дератирање и ограничења проток ваздуха треба третирати као основне теме дизајна, а не пуштање у рад.
Читаност у даљем опсегу плус стабилна мрежа садржаја. Ако далеко опсег не може да чита сат и да постиже резултате удобно, екран не успева у својој основној служби чак и ако репеи изгледају сјајно.
Пич треба да следи опсеге гледања и стил садржаја. Густе статистике и мали текст подстичу фини звук. Обумени распореди који су тешки за репелацију могу бити опроштајнији, посебно када су сјај и униформитет јаки.
Многи напољу плоче планирају у оквиру од 5.0008.000 нита, прилагођени излагању сунцу и углу. Контраст, контрола блицања и дисциплина шаблона и даље одређују перцептивну јасноћу.
Капацитет контролера, дисциплина планирања лука, складиштење резервне конфигурације, стабилност промене формата и видљивост надзора. Општи преглед помаже у орамкавању ове улоге: Видео процесор .
Швије су обично проблеми са механичким усклађивањем или калибрацијом, а не проблем броја пиксела. Плоскост, интегритет браве и подешавање за пуштање у рад смањују видљивост швака.
Процесна дисциплина је важна: јасноћа ФАТ/САТ, планирање радних токова услуга, квалитет документације, резервна стратегија и приступ праћењу. Ови елементи одређују дугорочно време рада више него кратка демо-учења.
Стадионски Џумботрон најбоље функционише када је планирање мерљиво. Величина екрана треба да следи линије погледа и фиксну решетку која штити читавост. Пикселови пич и резолуција треба да одговарају опсегу гледања и оперативном капацитету. Циљеви дизајна ванђерисјајалост, стратегија запљуњавања и топлотни простор за главу треба да се дефинишу као опсегови плус тестови. Стабилност система долази од обраде, транспорта, пријемне опреме, праћења и документације.