Stadion Jumbotron je infrastruktura. Prenosi ponove, vrijeme, statistiku, sponzorske petlje i sigurnosne poruke kroz sunce, kišu, vjetar i tesne kalendare događaja. Kvalitet slike je još uvijek važan, ali vrijeme rada, pristup usluzi, toplinski prostor za glavu i otporan lanac signala obično odlučuju da li se ploča osjeća "premium" tijekom cijele sezone. Led zidne ploče u skladu s člankom 3. stavkom 2. točkom (a) ovog članka, za potrebe ovog članka, za potrebe primjene Direktive 2008/57/EZ, za potrebe ovog članka, za potrebe ovog članka, primjenjuje se sljedeći standard:
Sredinom ljetnog popodneva, bljesak i vrućina mogu sravniti kontrast i izazvati toplinsko gušenje u najgorem trenutku. U drugi vikend, jedan kvar izlaznog porta može stvoriti zamračenje pola ekrana osim ako redundantnost i zoning nisu planirani oko stvarnih načina kvarova.
Ključne informacije
U slučaju da je u pitanju proizvod, potrebno je utvrditi veličinu.
Pikslovna visina je odluka o radnom toku koliko i vizualna odluka; viška rezolucije povećava mapiranje i opterećenje sadržaja.
U slučaju da se radi o ispitivanju, potrebno je utvrditi razinu i razinu za koje se radi.
Jumbotron je sustav: obrada, transport, primanje hardvera, praćenje i dokumentacija koji pokreće stabilnost događaja.
U slučaju da se ne provjere, potrebno je provjeriti da li je površina u skladu s zahtjevima iz članka 4. stavka 2.
Što je potrebno da stadionski jumbotron isporuči
Stadionski ekran rijetko radi samo jednu stvar. Ponovljenja, satovi, rotacije sponzora, pozivnice i hitne poruke dijele jedno platno pod promjenjivom svjetlošću. Uzimajući u obzir da je snimak emitiran u različitim svjetlima, gledatelji mogu vidjeti različite stvari, pa bi se stabilnost usmjerena prema kameri trebala smatrati osnovnim zahtjevima.
Slušatelj čitljivost i stabilnost emitiranja
Geometrija sjedala stvara širok vidni raspon. Gornje palube zavise od ploče za informacije. Donji dijelovi su obilježeni šavovima, strukturom piksela i artefaktima pokreta. Prenos dodaje još jedno ograničenje: ponašanje skeniranja i stabilnost osvežavanja mogu stvoriti trake ili treperenje na kameri čak i kada sjedala izgledaju prihvatljivo.
Praktično razmišljanje o planiranju odvaja pokaz ponovnog ponavljanja od čitljivosti informacija. Ponovite reprodukcije mogu tolerirati više motora zamagljenosti i skaliranje. Sat, rezultat i navodi ne mogu.
Pravilo dizajna: Ako se ponavljanja izgledaju dobro, ali sat je teško čitati iz daljnjeg pojasa, mreža je pogrešna, čak i ako je LED hardver izvrstan.
U slučaju da se ne provede ispitivanje, potrebno je osigurati da se ispitivanje provodi u skladu s člankom 6. stavkom 1.
Operativni timovi mjere uspjeh po uptime i brzini oporavka. Modularna površina koja se može brzo popraviti često nadmašuje površinu s većim specifikacijama na kojoj je teško doći. Tračnice za servisiranje, strategija rezervnih vozila i kartiranje kvarova određuju vrijeme oporavka, a ne uvjete za marketing.
Kalendar događaja komprimira prozore održavanja. Kratko servisno vrijeme zahtijeva radne tokove s prednjim pristupom, jasno označavanje ormara i kontroliranu proceduru za razmjenu modula, napajanja i prijemne opreme.
Sistem, a ne samo kupovina ormara
Sredstva su važna, ali rezultat "gotovosti" ovisi o sustavu oko njih: obradi, skali, prekidačima, dugotrajnom transportu, sinhronizaciji, praćenju i dokumentaciji. Odluke sustava u kasnoj fazi obično stvaraju skupe izbore u posljednji trenutak.
Katalog stranica koja drži ormariće, procesore i prijemni hardver vidljiv na jednom mjestu pomaže izbjeći fragmentirano planiranje: Katalog proizvoda za LED prikaz .
Velikost ekrana: od linije gledanja do mreže sadržaja
veći nije metoda mjerenja veličine. Pouzdana veličina dolazi iz vidnih linija, informacijske mreže i funkcionalne strukture.
Podijelite mjesto na gledanje
Jedina "prosječna udaljenost" skriva stvarnost. Korisnije je podijeliti:
Bliski opseg: u slučaju da se ne primjenjuje, to se može dogoditi u slučaju da se ne primjenjuje.
Srednji bend: u slučaju da se ne provodi ispitivanje, ispitivanje se može provesti u skladu s člankom 6. stavkom 2.
Daljnji bend: gornji paluba gdje je hrabra čitljivost i kontrast nosi iskustvo
Svaka traka stavlja različit naglasak na dizajn. Čitljivost u daljnjem opsegu obično je najteži zahtjev za ispunjenje.
Zaključajte mrežu sadržaja prije konačnih dimenzija
Fiksna mreža sprečava haos na dan događaja. Rezervira nekretnine za ponovljenu igru, sat / rezultat, ključne statistike i sponzorske okvirke bez smanjenja osnovnih informacija tijekom rotacija.
Zajednički crtežni uzorak uključuje:
Glavni prozor za ponovnu reprodukciju (često 16:9)
Trajni opseg podataka za sat i rezultat
Statistički moduli za ključne informacije (streljanja, greške, posjed, itd.)
S druge strane, za uređaje za proizvodnju električnih goriva, neovisno o tome jesu li oni proizvedeni iz električnih goriva ili iz električnih goriva
Bezbedne rubine koje štite čitljivost pod strmim kutovima
Disciplina mreže poboljšava dosljednost sponzora. Kada se sponzori ne bore protiv pogreške, operatori prestaju improvizirati.
Naputka za operatora: Sponsor vrijednost pada kada prekrivenosti pomaknu, promijeniti veličinu ili se pomaknuti tijekom igre uživo. Stabilna mreža održava postavljanje predvidljivo.
Structura tretiranja i pristup kao dio size
Kvadratni metari dodaju težinu, opterećenje vjetrom i složenost pristupa. U slučaju da se ne primjenjuje sustav za kontrolu struje, sustav za kontrolu struje može se koristiti za kontrolu struje. Planiranje pristupa štiti vrijeme rada.
Structuralno planiranje treba izričito obuhvatiti:
U slučaju da se ne primjenjuje, se može upotrebljavati sljedeći sustav:
U skladu s člankom 6. stavkom 1.
Svaka vrsta vozila mora imati svoj vlastiti sustav za upravljanje brzinom.
Pristupni platformi, zaštitne ograde i sigurna radna područja
U slučaju da je to potrebno, upotreba kablovske mreže može se ograničiti na:
Tehnički kontrolni punkt: Ako se ne kontrolira odklon, šavovi se odmiču i postaju vidljivi tijekom svjetlosti, jednaki sadržaj.
Kratko veličine tok rada koji ostaje prizemljen
Pouzdan protok mjerenja zadržava odluke konkretne:
Mapirajte vidne linije i definišite primarnu zonu čitljivosti.
Definirajte mrežu sadržaja s stvarnim veličinama pisaca i sigurnim maržama.
Izaberite odnos stranica koji odgovara ponovljenju i potrebama informacija.
Pretvorite fizičke metre u pikselno platno koristeći visinu.
Potvrditi strukturu, pristupne puteve, putanje staze, i kapaciteta kontrolera.
Ovaj redoslijed smanjuje rizik od izbora dramatične veličine prvo, a zatim oštećenja funkcionalnosti kasnije.
Pixel pitch i rezolucija: Praktična pravila koja ostaju korisna
Pixel pitch nije trofej specifikacija. To je izbor proračuna, radnog toka i održavanja koji oblikuje cijeli dizajn signala i usluge.
Pravilnik brzog polaganja na udaljenost za rano planiranje
Pravila nisu standardi, ali sprječavaju neregulacije:
U slučaju da je to moguće, za svaki od navedenih vozila, potrebno je upotrebiti sljedeće:
U slučaju da je to moguće, mora se upotrebljavati sljedeća metoda:
Gosti tekst, fine linije grafike i strmi uglovi gledanja pomjeraju udobnu udaljenost prema gore. Oblikovanje koje je teško ponoviti je oprostije.
U skladu s člankom 4. stavkom 1.
Sljedeća tabela namjerno je široka. Pomaže u ranoj raspravi o odabiru i planiranju proračuna, a zatim se usavršava s linijama pogleda i predlošcima sadržaja.
| Sjedalište |
Tipična upotreba na dan događaja |
Što mora izgledati najbolje |
Praktični smjer nagibanja (vanjski) |
| Bliski pojas |
Ponovite utakmice, grafika tima, bliska percepcija šavova |
Kontrola šavova, jasnoća kretanja, jednakih |
-Pomoglo je, ali i dalje je važno. |
| Srednji pojas |
Ponovljene utakmice + čitljive statistike |
Ravnotežena jasnoća i svjetlost |
Srednji raspon je često najbolji odnos troškova i koristi |
| Daljni pojas |
Sat, rezultat, veliki nagovori |
Čitljivost u žestokoj verziji, visok kontrast |
Groblje visine mogu raditi ako su šablone su jaki |
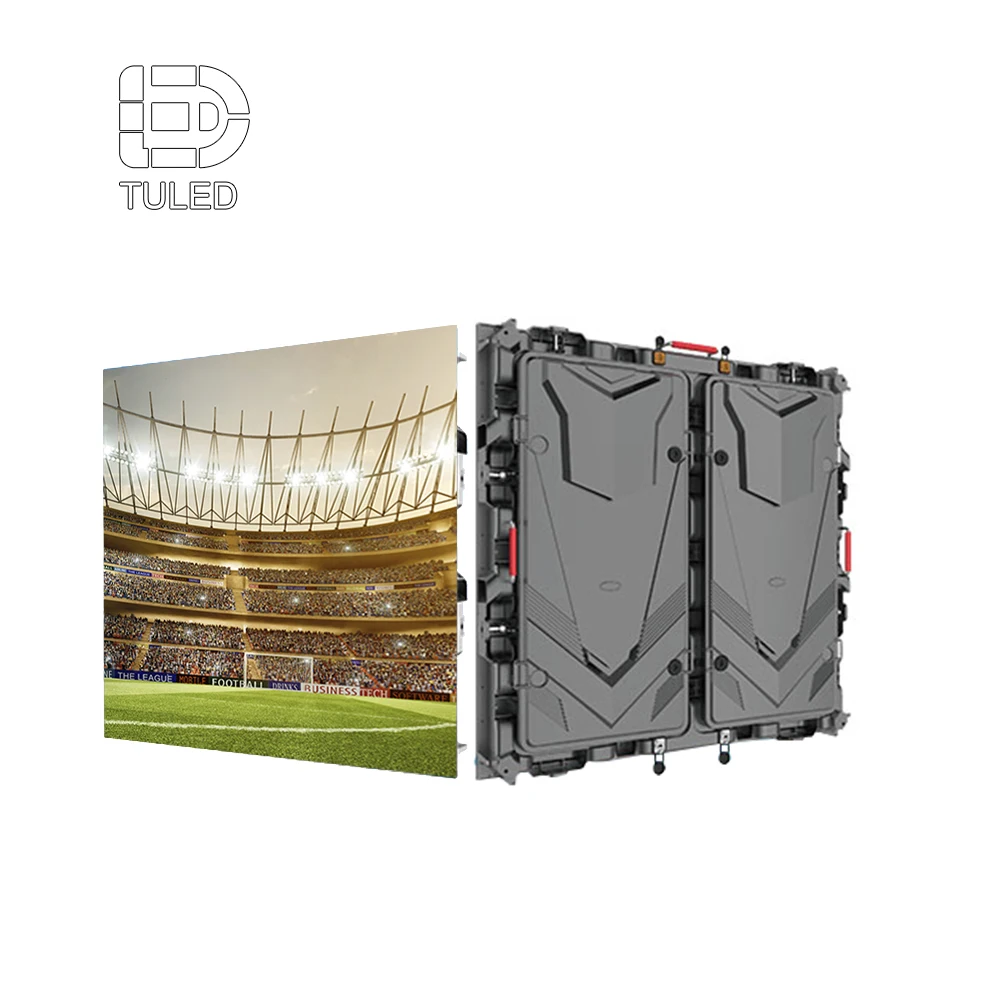
Mješoviti prizori su uobičajeni. Konkurs i kontrolna područja često opravdavaju finji ton, dok glavna LED video ploča stadiona ima koristi od pragmatičnog tonusa plus jake svjetlosti i jednakoće.
Rezolucija mijenja sustav, ne samo sliku
Više piksela povećanje:
Upravljač za izlazni opterećenje i složenost planiranja luka
Primanje broja hardvera i mapiranje radnog opterećenja
U skladu s člankom 6. stavkom 2.
Upotreba sadržaja za proizvodnju sadržaja za svaki događaj
"Skriveni trošak" je zadovoljstvo. Ploče visoke rezolucije još uvijek izgledaju mekano ako su izvori često povećani ili slabo deinterlaced. Za timove kojima je potrebno osvježenje razmišljanja o odabiru piksela, ovaj vodič je korisna referentna točka: Najbolja veličina piksela za LED zaslone male udaljenosti .
Radno mjesto obrnuto prema kameri: stabilnost osvežavanja i ponašanje sivih stupnjeva
U snimci emitiranja često se otkrivaju trake i skeniraju artefakti prije nego što ih gledatelji primjete. U javnim nabavkama jezik je najjači kada se usredotoči na rezultate:
Stabilno ponašanje osvežavanja u skladu s kamerama
Glatka izvedba u sivom stupnju s minimalnim pramenom
U skladu s člankom 6. stavkom 2.
Jednakost je često odlučujući faktor na velikim platnama. Dobro kalibrirana površina s čvrstom kontrastom često se čita oštrije od površine s većom gustoćom s nekonzistentnim šavovima ili drastičnom svjetlost.
Ciljevi za vanjske prostorije: Blagost, bljesak, IP strategija i izdržljivost
U slučaju da je proizvod u stanju da se koristi za proizvodnju električne energije, mora se upotrebljavati sustav za mjerenje emisije energije. Taj okvir održava planiranje realističnim i testiranim.
Ciljevi svjetlosti u nitama
Mnogi vanjski stadioni su u 5000 8000 nitova , ovisno o smjeru mjesta, izloženosti suncu i kutu ekrana. Veća svjetlost može pomoći u ekstremnim sunčevim svjetlima, ali povećava potrebe za toplinom i energijom. Kontrast, površine protiv osvijetljenja i konzistentnost kalibracije još uvijek odlučuju da li sadržaj izgleda čisto.
Za širi pregled kategorija za vanjske prostorije koje se koriste u različitim aplikacijama, ova stranica pomaže u okviriranju tipičnih očekivanja svjetlosti i vodootpornosti: Vanjski LED zaslon .
Odraz svjetlosti i odraz
Glare je tihi ubojica sponzora. Odraz može izbrisati svijetle pozadine i smanjiti jasnoću ponovnog prikazivanja u podne. Dizajn maske protiv osvijetljenja i disciplina šablona pomažu u smanjenju percipiranog pranja.
U slučaju da je u pitanju oblikovanje obrasca:
Koristite debelu tipografiju i jasnu hijerarhiju
U skladu s člankom 4. stavkom 2.
Izbjegavajte fine linije i suptilne nagibove za čitanje u daljnjem pojasu
Napomena na terenu: Sranje u podne često najprije povrijedi sponzorske module jer te zone koriste svijetle pozadine i pokretnu animaciju.
U slučaju da se ne primjenjuje, to se može učiniti u skladu s člankom 6. stavkom 1.
Zaštita vanjskih prostora je više od oznake. Projekt obično ima koristi od:
Čiste prednje ciljeve zaštite od prašine i kiše
Zaštita spojeva i zaštita ulaza kabla
U skladu s člankom 21. stavkom 2.
U slučaju da se ne primjenjuje, zahtjevi za zaštitu
U slučaju da je to potrebno, potrebno je utvrditi kriterije za utvrđivanje zahtjeva za zaštitu. Vanjske LED ploče .
Mehanička izdržljivost: vjetar, vibracije i korozija
Vjetro utječe na sigurnost i stabilnost šavova. Vibracije mogu tijekom vremena otpustiti hardver ako zaključci nisu čvrsti. Priobalna okolina povećava rizik od korozije koja utječe na vezivače, spojeve i kablovske omotače.
Trajni plan uključuje:
Structuralna revizija usklađena s lokalnim kodovima
Izbor materijala osjetljivog na koroziju ako je potrebno
U slučaju da je to potrebno, za potrebe primjene ovog članka, nadležna tijela mogu se odlučiti o tome da li će se primjenjivati sljedeći zahtjevi:
U skladu s člankom 4. stavkom 2.
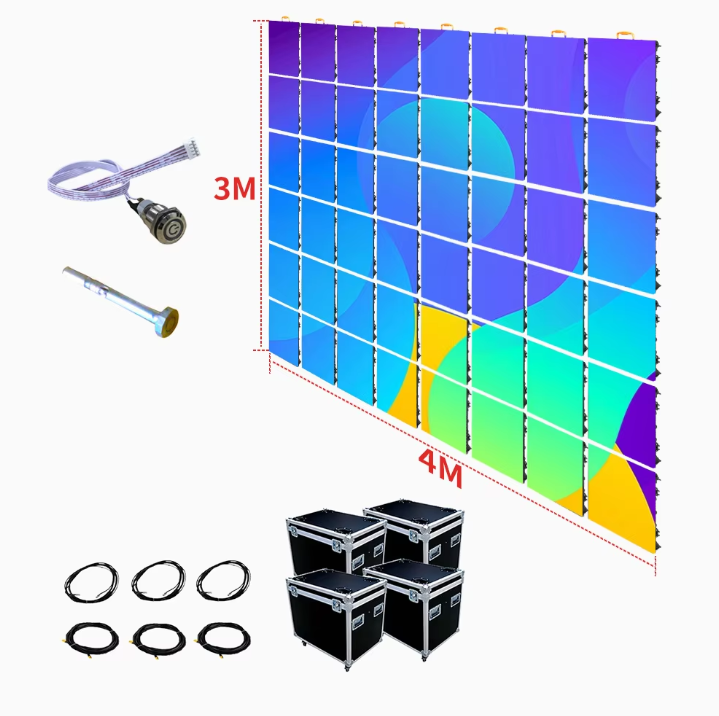
Primjer: Od metara → piksela → ormarića → kontrolnih vrata
Radni primjer pretvara konceptualnu raspravu u popis planiranja. Prikazani brojevi ilustriraju proces i logiku, a ne određeno obećanje brenda.
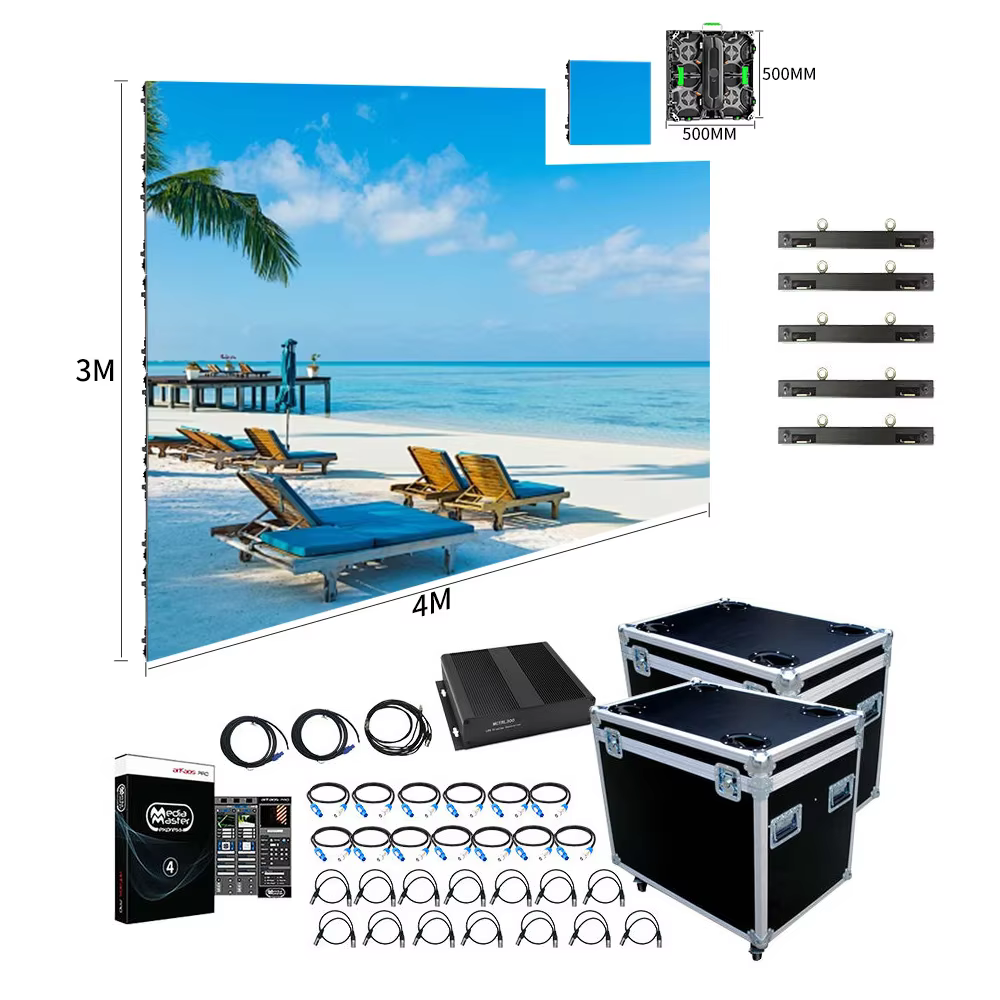
Korak 1: Definirajte realnu veličinu ploče
Pretpostavimo da je glavna ploča koncept s 16:9 platnom:
Širina: 20 m
Visina: 11,25 m
Ova veličina podržava veliki prozor za ponovnu igru plus strukturirani informacijski pojas.
Korak 2: Odaberite visinu za primjer i pretvorite u piksele
Koristite primjer planiranja sklonine za otvaranje .
Konvertiranje metara u milimetre:
Širina: 20.000 mm
Visina: 11.250 mm
Podijeliti po visini:
Ukupno brojeve piksela:
Taj broj je već dovoljno velik da kapaciteta kontrolera i planiranje luka postanu primarni pokretači dizajna.
Korak 3: Dodajte prostor za kontrolu i kapacitete upravljača plana
Velika platna imaju koristi od planiranja prostora za redundantnost i disciplinu mapiranja. Praktična glava je 15–25%- Što? Sa 20% prostora za glavu:
U slučaju da se ne može utvrditi da je to potrebno, potrebno je utvrditi:
Broj ishoda i organizacija luke
Mogućnost pohranjivanja i vraćanja kopija mape
Stabilnost pri promjeni formata i pri zamjeni
Sljedeći članak
Stranica kategorija koja objašnjava što video procesor radi u smislu sustava može podržati ovu fazu planiranja: Video procesor - Što? Primjer konkretnog procesora također može biti koristan pri usklađivanju tipova ulaza i koncepata mapiranja: Novastar VX400 Video procesor .
Korak 4: Prevedite piksele u ormare i zone za usluge
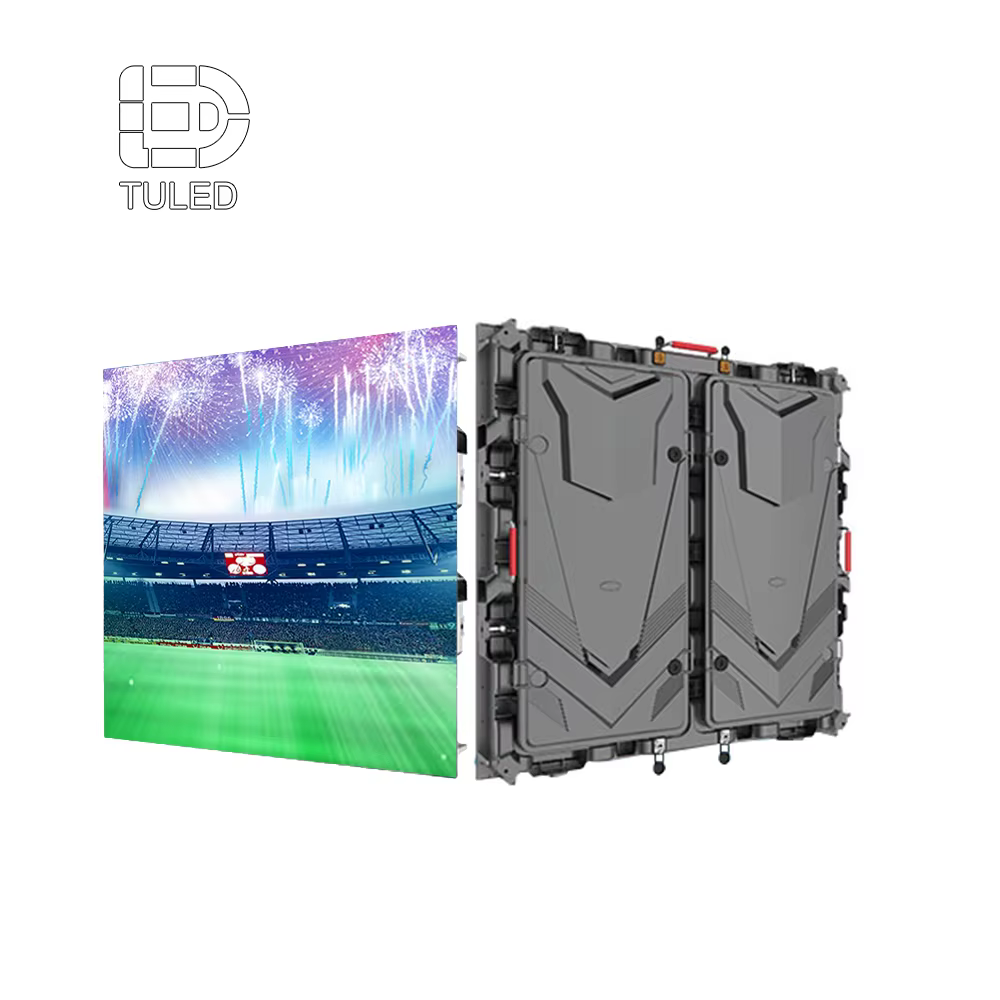
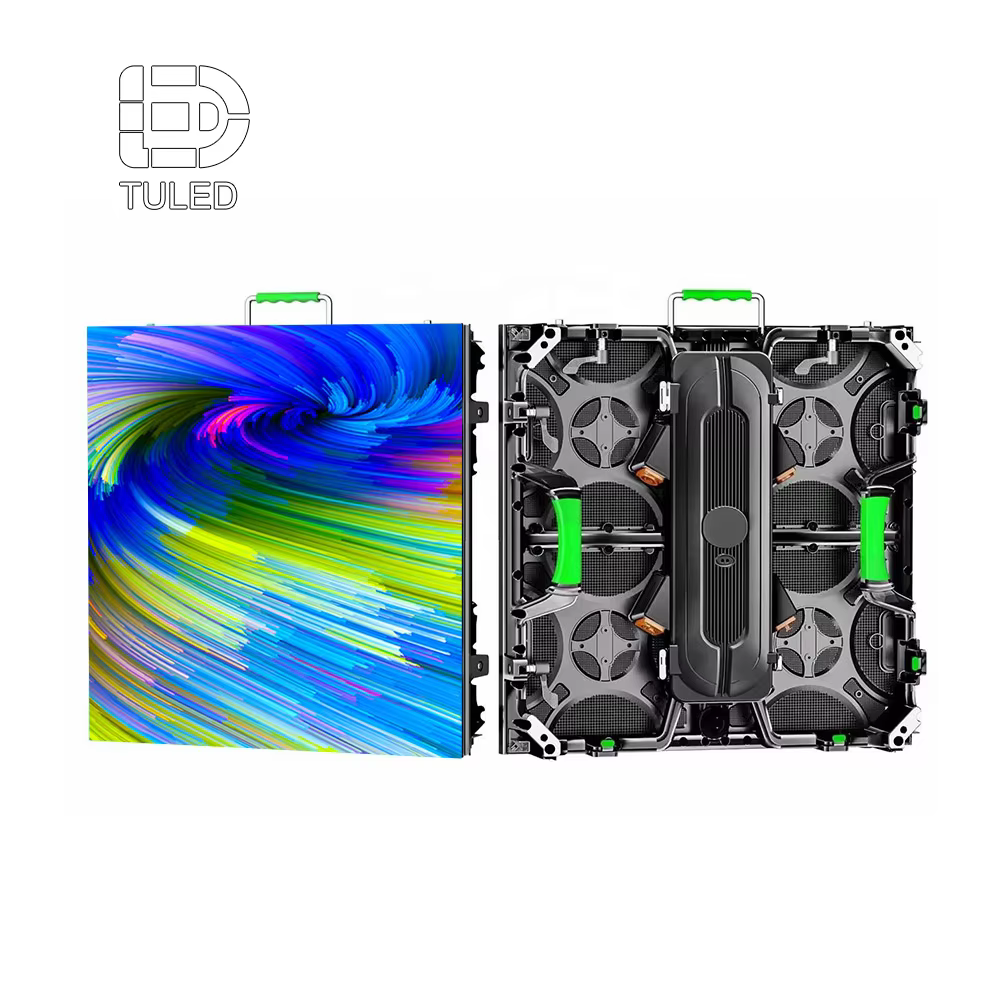
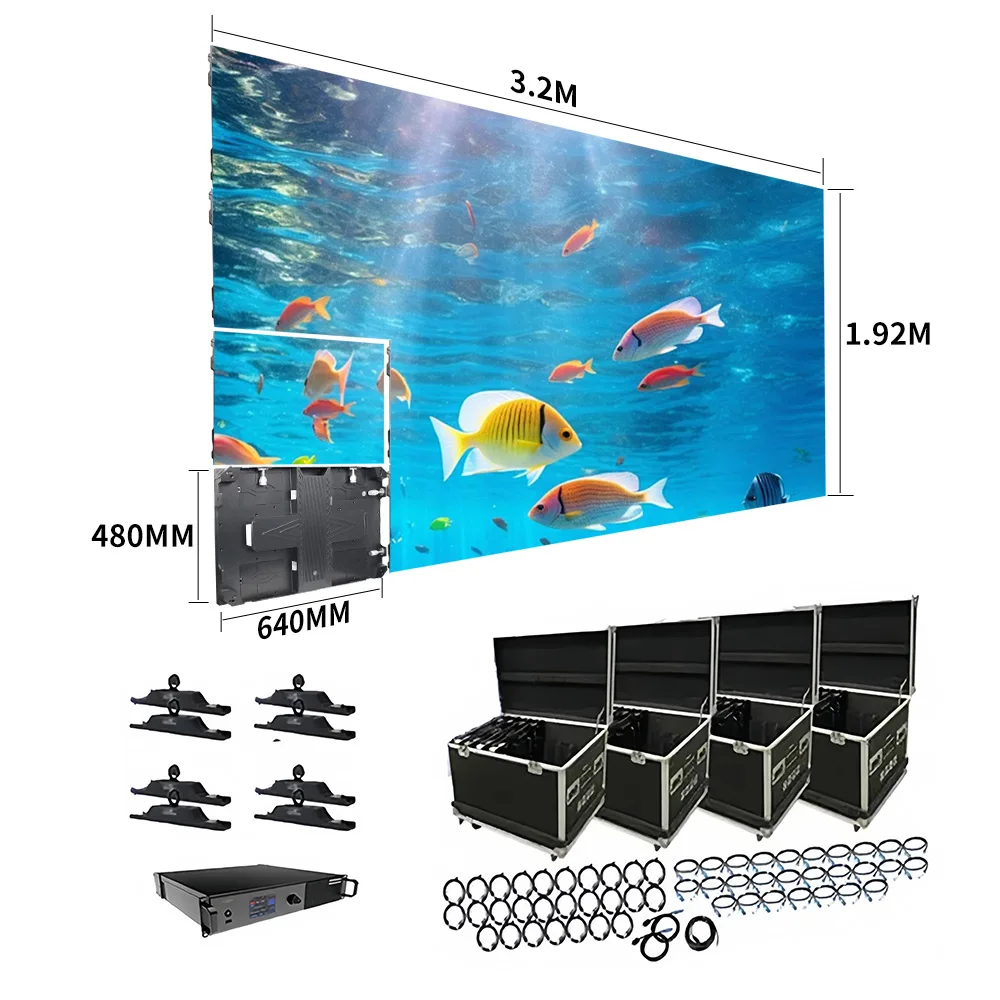
Veličina ormara definiše fizičku mrežu. Mnoge vanjske ploče koriste standardizirane formate ormara jer pojednostavljuju strukturu, rezervne dijelove i postupke održavanja. Brojka ormara zatim vozi:
Zoni za distribuciju električne energije
U skladu s člankom 4. stavkom 2.
Planiranje rezervnog modula
U skladu s člankom 21. stavkom 2.
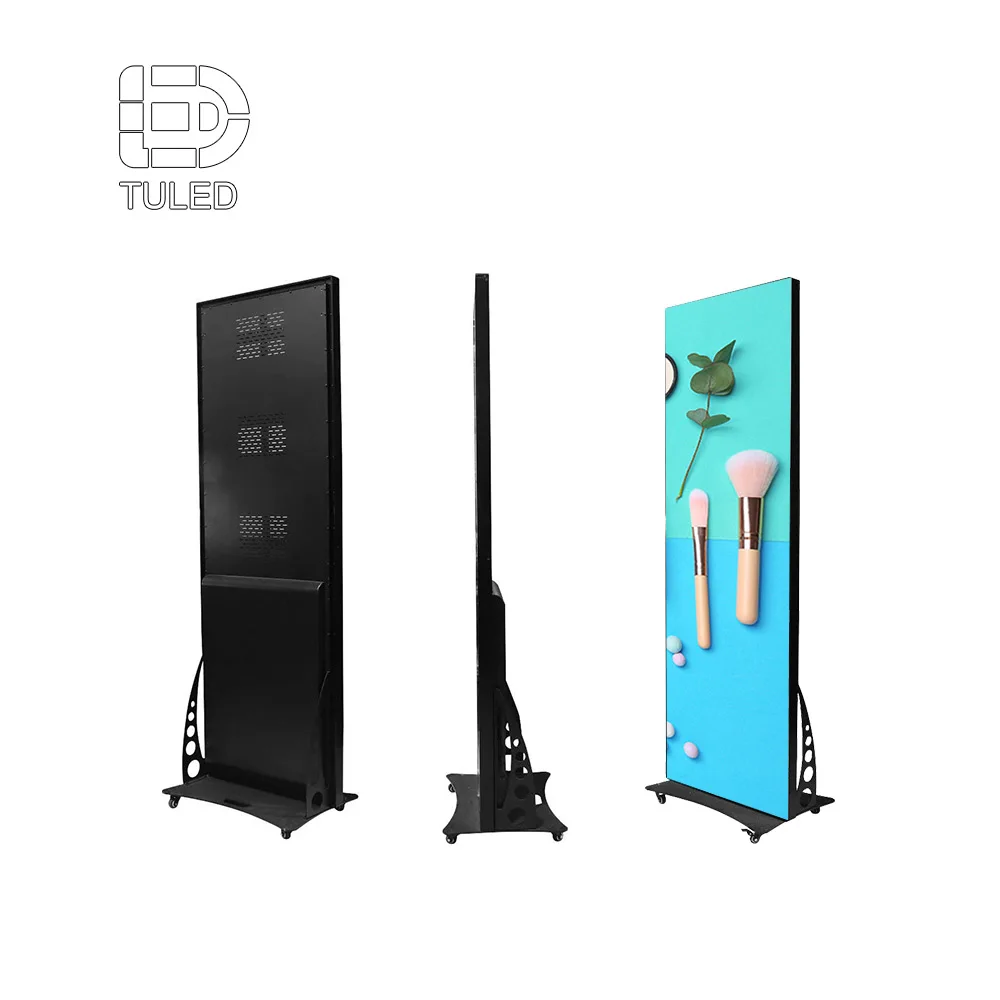
U ovoj fazi, Led zidne ploče najbolje je tretirati ih kao građevinske blokove, a ne kao ekran. Format ormara i način održavanja određuju brzinu čišćenja kvarova.
Korak 5: Povežite fizičku mrežu s ograničenjem prekida
Snažan dizajn sustava ima za cilj graciozan neuspjeh:
Jedan prekidač ne bi trebao zasjeniti cijelo ponovno prikazovanje.
Jedini kvar prihoda ne bi trebao ubiti pola ekrana.
Jedini kvar prijemne opreme treba biti izoliran na malo područje.
U slučaju da je to potrebno, u slučaju da je to potrebno, u slučaju da je to potrebno, u slučaju da je to potrebno, u slučaju da je to potrebno, u slučaju da je to potrebno, u slučaju da je to potrebno. Ako se karta upravljača ne poklapa s planom fizičkog pristupa, oporavak postaje spor tijekom događaja.
Moć, vrućina i smanjenje kvalitete: Što zapravo nije u dobrim igrama
Mnoge "tajanstvene greške" su energetske ili toplinske greške. Danne igre su najteži test jer sunčeva svjetlost, vrućina i visoka svjetlost zahtijevaju maksimalnu stabilnost.
Tipični raspon snaga i što ih mijenja
Moć varira u zavisnosti od svjetlosti, sadržaja, visine i dizajna ormara. Međutim, rano planiranje često koristi širok raspon:
Blisko bijelo sadržaj gura vrhove. Tamni sadržaj snižava prosječno. Služba koja pokreće sponzorske petlje s svijetlim pozadinama može imati veći prosječni učestalost od mjesta s tamnijim grafičkim paketima.
Strategija zoniranja za sprečavanje potpunog nestanka struje
Zonizacija energije bi trebala ograničiti utjecaj odlaska ili prekida snabdijevanja. Korisni načeli zonizacije uključuju:
Razdijeliti jezgro ponovnog prikazivanja i datoteke u različite zone
Stagger zone tako da prekid ne uklanja kontinuiran blok preko centra
Označite zone tako da je izolacija greške brza.
Ujednačite zonizaciju s fizičkim pristupom tako da usluge ostanu sigurne
Plan zonizacije koji ne uspije graciozno štiti kontinuitet događaja čak i pod greškama.
Sredstva za upravljanje energijom
Neki su stadioni zahtijevaju da odbor prođe kroz kratke tranzicije. Drugi dopuštaju kontrolirano ponašanje. Pitanja koja smanjuju iznenađenja:
U slučaju da je sustav za upravljanje sustavom za upravljanje brzinom (UPS) u stanju da se koristi za upravljanje brzinom, potrebno je osigurati da je sustav za upravljanje brzinom (UPS) u stanju da se koristi za upravljanje brzinom.
Koliko dugo bi kontrolni sloj trebao ostati živ tijekom prijenosa?
Koja je sekvenca ponovnog pokretanja ako se napajanje zaustavi usred događaja?
Definirana sekvenca smanjuje stres operatora. Također sprečava pomicanje konfiguracije nakon neplaniranog ponovnog pokretanja.
U slučaju da je to potrebno, mora se provjeriti da li je to moguće.
Izvanjske ormare žive u toplini. Sunce dodaje više toplote. Ako je toplinski prostor tanak, smanjenje svjetlosti obično se pojavljuje tijekom najvidljivijih dnevnih događaja.
U skladu s člankom 4. stavkom 2.
U slučaju da se ne primjenjuje, primjenjuje se sljedeći uvjet:
U slučaju izloženosti suncu
U slučaju da se ne primjenjuje, mora se upotrebljavati sljedeći sustav:
U slučaju da je to potrebno, mora se utvrditi da je to potrebno za ispitivanje.
U skladu s člankom 4. stavkom 2.
U slučaju da je to potrebno, točka 3. Ako je toplinski prostor tanak, smanjenje svjetlosti se pojavljuje tijekom vrhunskih dana prisutnosti.
Zaštita od prevrtanja i strategija uzemljavanja
Vanjska infrastruktura treba planiranje za prebrze napade. Opasnost od munje i prekidajući prolaznici mogu oštetiti osjetljivu elektroniku. Praktični plan obično uključuje:
Zaštita od nadjačanja na ključnim distribucijskim točkama
Sklop koji je usklađen s električnim kodom
U skladu s člankom 6. stavkom 2.
Ovaj se učinak ne može primijetiti od prvog dana, no često je od značaja za dugoročnu pouzdanost.
U skladu s člankom 3. stavkom 1.
Čista slika ovisi o čistom lancu. Također ovisi o sposobnosti brze dijagnosticiranja mana.
Praktični lanac signala stadiona
Tipični lanac signala uključuje:
S druge strane, za uređaje za uređivanje fotografija, koji se koriste u proizvodnji grafičkih grafika, ne vrijede:
Snimak ili usmjeravanje (SDI ili IP video, ovisno o tokovima rada na mjestu održavanja)
U slučaju potrebe pretvaranje (u najmanju moguću mjeri)
S druge opreme za upravljanje video-izvodima
Dugi prijevoz, često vlakna za udaljenost i imunitet na buku
S druge strane, za uređaje za primanje podataka u sustavu za primanje podataka u sustavu za primanje podataka u sustavu za primanje podataka u sustavu za primanje podataka u sustavu za primjenu podataka u sustavu za primjenu podataka u sustavu za primjenu podataka u sustavu za primjenu podataka u sustavu za primjenu podataka u sustavu
Kad je lanac previše složen, greške postaju teže izolirati. Kada se konverzije smanje, stabilnost se poboljšava.
Rezidans koji odgovara stvarnim režimima neuspjeha
U slučaju da se ne provede ispitivanje, potrebno je utvrditi:
Ulazni podaci za rezervno upravljanje iz rutiranja/prebacivanja
Pripremljenost procesora u stanju pripravnosti s pohranjenim sigurnosnim kopijama konfiguracije
Dizajn putanje podataka koji ograničava veličinu prekida
Zone napajanja koje sprečavaju nestanak struje na cijelom ekranu
Testiranje čini redundantnost stvarnom. Bez testova, otpuštanje je nada.
U slučaju da se primanja ne provode, potrebno je osigurati da se ne provode u skladu s člankom 6. stavkom 2.
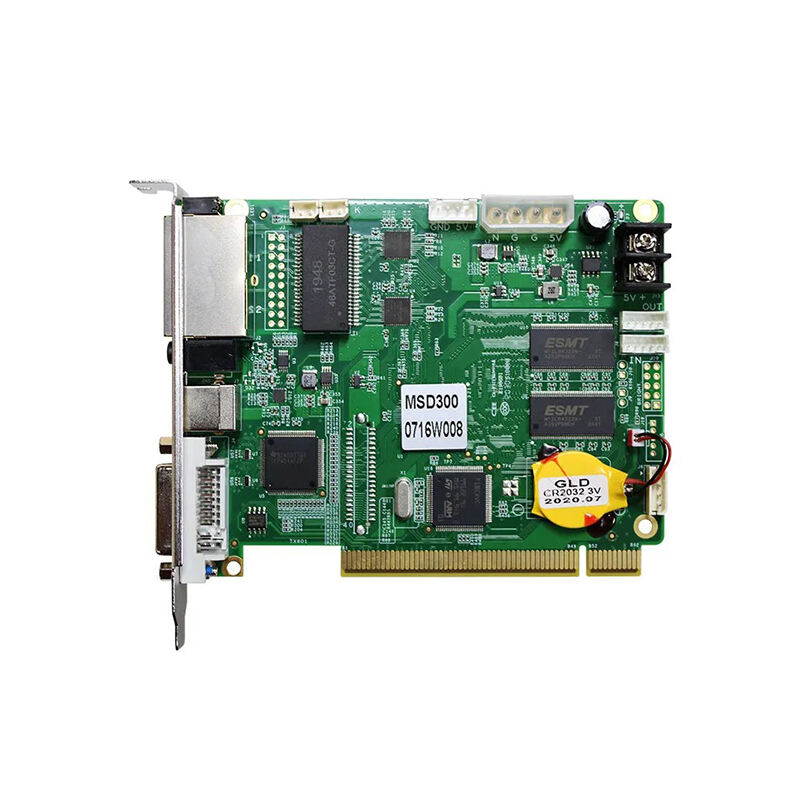
Primanje hardvera utječe na stabilnost mapiranja, vidljivost praćenja i tokove rada kalibracije. Stranica s pregledom kartice za primanje pomaže u okviru uloge hardvera za primanje i zajedničkih značajki koje se koriste u modernim izradama: Primanje kartice .
Kalibracijska kvaliteta se prikazuje kao:
Glatke grejskalične rampe bez traka
U skladu s člankom 4. stavkom 2.
Stabilna boja tijekom svih godišnjih doba
Smanjena vidljivost šavova tijekom svjetlosti
U dokumentaciji bi se trebale pohranjivati osnovne linije kalibracije i izvoz kartiranja. Ti podaci postaju "osiguranje" za vrijeme popravaka u sredini sezone.
U skladu s člankom 4. stavkom 2.
Monitoring smanjuje vrijeme popravka kada su alarmi aktivni. Korisno praćenje uključuje:
Status luke i zdravlje kabineta
Anomalije u zoni snage
Temperaturni alarmi vezani za stvarne radne korake
U slučaju da se primjenjuje primjena ovog članka, to se može primjenjivati na:
Izvoz evidencijskih evidencija za dijagnozu nakon događaja
Plan nadzora koji stvara stalnu buku je kontraproduktivan. Plan s jasnim pragovima gradi povjerenje.
U skladu s člankom 3. stavkom 2.
Kvalitet instalacije može učiniti istu hardver izgledati bolje ili gore. U slučaju da se projektni tim ne uspije Led zidne ploče kao sustav koji se može održavati (ne samo površina), pristupne trake, usmjeravanje kablova i oporavak od grešaka postaju mnogo lakše standardizirati.
Uređaj za montažu: zid u krajnjoj zoni, središnji visak, fasada
Svaki stil montaže ima predvidljive kompromise:
Završna zona zidnog montaža: često jednostavniji pristup i usmjeravanje
Srednja visina: najbolja vidljivost, veća strukturna složenost
Četvrta kategorija:
Planiranje pristupa trebalo bi biti odlučujući čimbenik. Ako rutinski popravci zahtijevaju složene postavke dizala, vrijeme zastoja se povećava.
Služba prednje i stražnje strane
Prednja služba smanjuje potrebe za zadnjim prostorom. Zadnja služba može biti učinkovita kada postoji prostor. Odgovarajući izbor ovisi o ograničenjima mjesta održavanja i planiranju sigurnosti.
Planiranje prednje službe trebalo bi se baviti:
U slučaju da je to potrebno, potrebno je utvrditi način za isporuku.
Bezbedne radne zone i platforme
U slučaju da se ne primjenjuje, za svaki proizvod koji se upotrebljava za proizvodnju čeličnih žiga, potrebno je upotrijebiti sljedeće metode:
Zaštita od oštećenja tijekom učestalih pristupa
Disciplina kablovskog usmjeravanja
U slučaju da se instaliraju nove kablove, potrebno je da se i nakon instalacije održava usmjeravanje kablova:
Označavanje koje odgovara dokumentima mapiranja
Sredstva za obradu
U slučaju da je to moguće, potrebno je osigurati da se električna energija i podaci koriste u različitim smjernicama.
Pristupni trake čuvani su slobodni nakon izgradnje
Kada je rutiranje čisto, rješavanje problema je brže i sigurnije.
Uvođenje u rad u stvarnim uvjetima
Upućivanje stvara gotovljeni izgled:
U skladu s člankom 6. stavkom 1.
Kalibracija svjetlosti i jedinstvenosti boje
U skladu s člankom 4. stavkom 1.
Sastavljanje osnovne vrijednosti za referencijsku održavanje
Testni uzorci su korisni, ali pravi video otkriva stvarne probleme. U redu je da uključi pokrete u stilu ponovnog igranja, sponzorske petlje i stvarni raspored rezultata.
Sljedeći članak:
Prije predaje, provjerite da je ekran spreman za sadržaj utakmice.
Spojovi i poravnanje: za potrebe ovog članka, za sve proizvode koji se upotrebljavaju za proizvodnju električne energije, primjenjuje se sljedeći standard:
Karta i skala: u skladu s člankom 3. stavkom 2.
Neuspjeh: odvojiti jedan signalni kabel ili isključiti jedan port da potvrdi planirani backup put održava stabilan prikaz
Snaga i toplina: provjerite zone snage, a zatim pokrenuti sadržaj visoke svjetlosti dovoljno dugo da potvrdi protok zraka i temperature ponašanja
Jednoličnost: u slučaju da se ne primjenjuje primjena ovog članka, za sve druge proizvode koji se upotrebljavaju u proizvodnji proizvoda, primjenjuje se sljedeći standard:
Zaštita i predaja: u slučaju da se programski sustav ne može koristiti za održavanje, potrebno je uključiti:
Stadionska ploča je izgrađena od modula. Dizajn ormara utječe na stvarne operacije: ravnost kontrolira šavove, integritet bravice kontrolira dugoročno poravnanje i kontrolu pristupa uslugama.
Uskladiti formate s scenarijima sprečava prisiljavanje jednog tipa ormara da se nosi s svakom ograničenjem.
Velika platna otkrivaju varijacije serija. Praktična strategija za rezervne proizvode uključuje:
Popravka koja zadržava ravnomjernost je bolja od popravke koja uvodi slojeve svjetlosti.
Vrijeme smanjuje zbunjenost. Također, jasno pokazuje što se mora odlučiti ranije, a što se može popraviti kasnije.
Proizvodnja prihvaćanja testiranja smanjuje rizik na mjestu radnje tako što rano otkriva probleme. Također proizvodi temeljne podatke za kasnije rješavanje problema.
Predvidivi kadenci održavaju površinu konzistentnom i smanjuju pomicanje.
Kontrolne liste trebaju biti djelotvorne. U slučaju da se ne primjenjuje, to se može učiniti u skladu s člankom 6. stavkom 2.
U slučaju da se ne provede ispitivanje, ispitni sustav mora biti u stanju provesti ispitivanje.
U skladu s člankom 4. stavkom 2. točkom (a) ovog članka, za potrebe održavanja mora se upotrebljavati:
Tačna količina ovisi o gustoći događaja i prihvatljivom vremenu za vraćanje vizualne savršenosti.
Jasno kartiranje pretvara stresnu grešku u kontrolirani postupak.
Kalibracija nije jednokratna. Praktični ritam uključuje:
Dosljednost tijekom godišnjih doba često ovisi o ovom ritmu.
Praćenje smanjuje vrijeme zastoja kada se alarmi mogu aktivirati. Korisni alarmi uključuju:
Alarm disciplina je važna. Previše upozorenja postaje buka; jasni pragovi postaju povjerenje.
Cilj je suzbijanje. Dobro zonizirani sustav elegantno propada.
Često je rješenje kombinacija discipline šablona i kontrole površinskog bljeskavanja, a ne samo više nitki.
Ovaj problem je lakše spriječiti nego kasnije "izbaciti".
Termalni prostor za glavu je obično kriv. U skladu s člankom 3. stavkom 1. stavkom 2. ovog Pravilnika, radi se o ograničenjima u upravljanju toplinom, smanjenju razine i protoku zraka kao osnovnim temama dizajna, a ne popravcima prilikom puštanja u rad.
Čitljivost šireg pojasa plus stabilna mreža sadržaja. Ako dalekoj frekvenciji ne može čitati sat i pogoditi rezultat, ekran ne radi svoj osnovni posao čak i ako replay izgleda odlično.
Pitch bi trebao slijediti gledanje traka i stil sadržaja. Guste statistike i mali tekst guraju visinu. Oblačenje koje je teško ponoviti može biti oprostivije, posebno kada su svjetlost i jednakoća jaka.
Mnoge vanjske ploče planiraju unutar 5.0008.000 nitova, prilagođene izlaganju suncu i kutu. Kontrast, kontrola bljeskavanja i disciplina šablona još uvijek određuju očitu jasnoću.
Kapacitet upravljača, disciplina planiranja luka, skladištenje rezervne konfiguracije, stabilnost promjene formata i vidljivost praćenja. Opći pregled pomaže u oblikovanju ove uloge: Video procesor .
Šavovi su obično mehanički poravnanje ili kalibracije nesukladnost problema, a ne problem broja piksela. Ravnoteža, integritet zaključavanja i poravnanost prilikom puštanja u rad smanjuju vidljivost šavova.
U slučaju da je to potrebno, potrebno je utvrditi razine i razine zauzimanja. Ti elementi određuju dugoročno vrijeme rada više nego kratka demonstracija.
Stadion Jumbotron najbolje funkcionira kada je planiranje mjerljivo. Veličina ekrana treba biti u skladu s vidnim linijama i fiksnom mrežom koja štiti čitljivost. U slučaju da je to potrebno, sustav će se koristiti za određivanje veličine i veličine. Ciljevi dizajniranja vanjskih objekata sjaj, strategija zatvaranja i toplinski prostor trebali bi se definirati kao rasponovi plus ispitivanja. Stabilnost sustava dolazi od obrade, transporta, primanja hardvera, praćenja i dokumentacije.